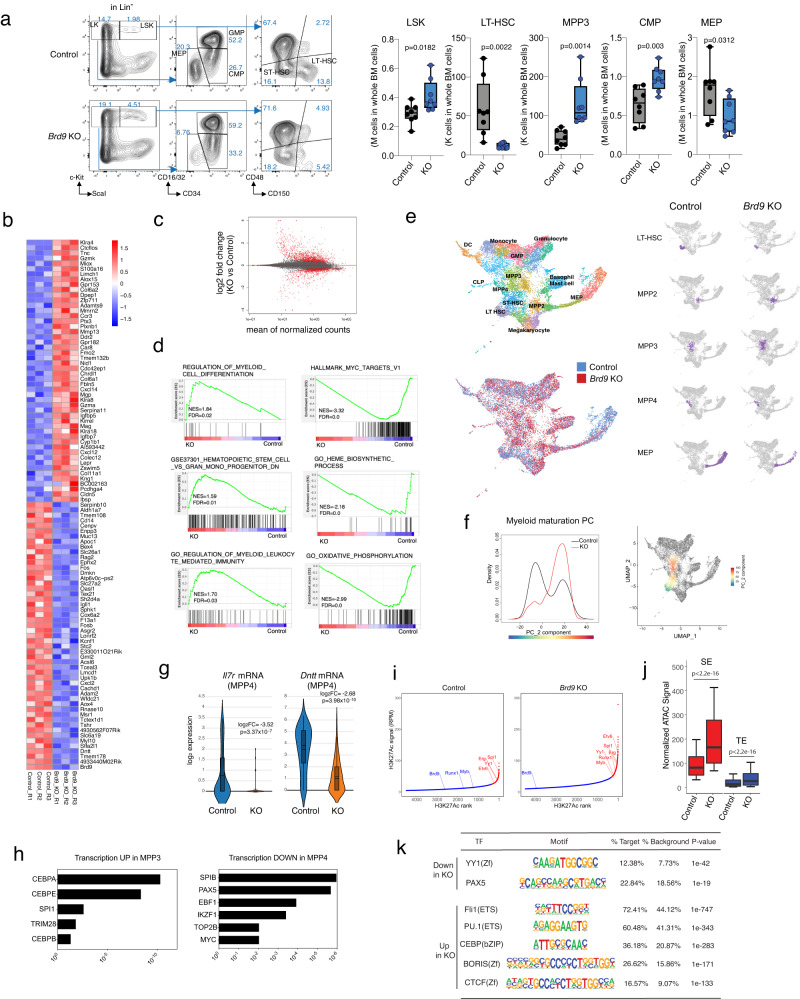
Fig. 3. BRD9 loss transcriptionally alters the cell fate specification of HSCs in vivo.
a FACS analysis and gating strategy of BM cells from representative primary mice for evaluating the ratio of stem and progenitor fraction. Box-and-whisker plots of numbers of LSK, LT-HSCs, MPP3, CMPs, and MEPs in BM of primary 6-month-old Brd9fl/fl (Control) and Mx1-Cre;Brd9fl/fl (KO). n = 8 independent samples, both males and females; error bars, means ± s.e.m. For box and whiskers plots, bar indicates median, box edges first and third quartile values, and whisker edges minimum and maximum values. p value relative to control by a two-sided t-test. b Heatmap showing the top 50 up- or down-regulated genes evaluated by RNA-seq in BRD9 KO HSPCs. c MA plot showing differentially expressed genes (adjusted p value < 0.1). p values were obtained by applying Wald test to absolute values of log2FC and adjusted using the Benjamini-Hochberg correction. d GSEA enrichment plot for dysregulated genes in RNA-seq of KO vs. Control. e Identification of different hematopoietic clusters in Control and KO Lin−cKit+ cells base on UMAP analysis from single-cell RNA sequencing (scRNA-seq). The estimated fractions of stem, progenitor, and mature cells are labeled and highlighted. f Cellular densities along Myeloid maturation PC and the scaled values of the maturation PC visualized on UMAP space. g The violin plots of Il7r and Dntt mRNA expression in the indicated cluster, where 158 and 148 cells belong to Control and KO, respectively. Box plot and kernel density plot of log2 expression values are shown. p values were obtained by negative binomial test and adjusted using the Benjamini-Hochberg correction. In the box-and-whisker plots, the 0th, 25th, 50th, 75th and 100th percentiles and mean (dashed lines) are shown. h Transcriptional factor motif analysis of genes upregulated in MPP3 (left) and downregulated in MPP4 (right) of KO mice. p values are indicated and generated via Enricher. i Enhancers ranked by H3K27ac ChIP-seq signals in HSPCs of Control and KO mice. SEs (red) and TEs (blue) were identified using HOMER software. j Normalized ATAC-seq signal (RPGC) at SE and TE (detected with HOMER fdr <0.001) in HSPCs. One biologically independent sample in each group was used. Results of additional biologically independent samples are shown in Supplementary Fig. 5f. The p values were obtained by two-sided Wilcoxon rank sum test. In the box-and-whisker plots, the 10th, 25th, 50th, 75th and 90th percentiles are shown. k Transcriptional factor motif analysis of typical enhancers (TE) by comparing TE peaks between Control and KO HSPCs. Source data are provided as a Source Data file.

