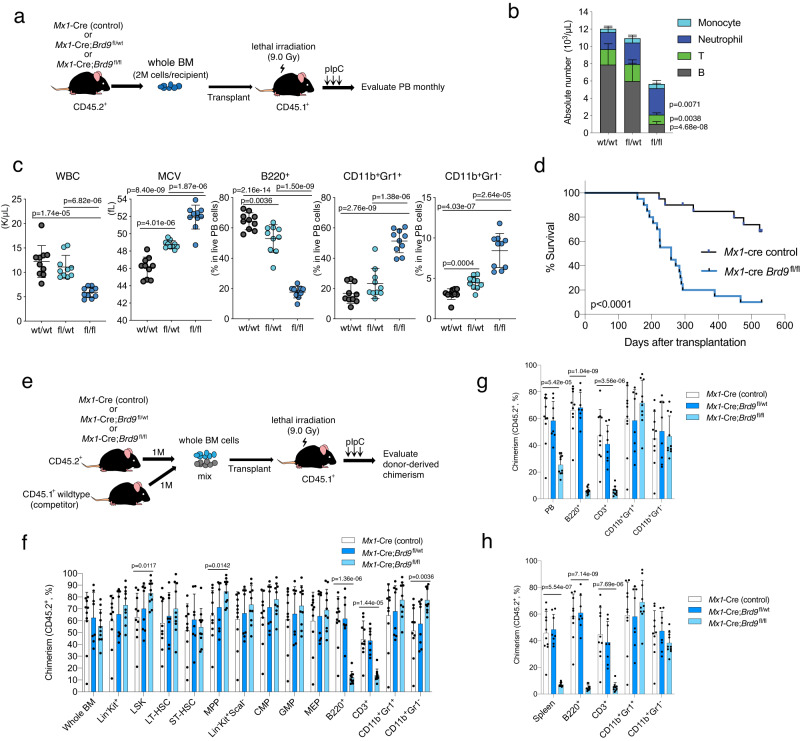
Fig. 4. BRD9 loss disturbs the cell fate of HSCs in a cell-autonomous fashion.
a Schema of non-competitive BM transplantation assays. b Absolute number of B220+, CD3+, CD11b+Gr1+, CD11b+Gr1− cells in the PB of each group. n = 10 independent samples; mean and s.e.m are plotted. p value relative to control by a two-sided t-test. c Plots of WBC, MCV, and the proportion of B220+, CD11b+Gr1+, and CD11b+Gr1− cells in PB of recipient mice. n = 10 independent samples; error bars, means ± s.e.m. Statistical significance was calculated with two-tailed unpaired t-test. d Kaplan-Meier survival of each recipient group. p value was calculated by log-rank test. e Schema of competitive BM transplantation assays. Percent of donor-derived (CD45.2+) cells of each indicated population in BM (f), PB (g), and spleen (h) following 5 months of transplantation. n = 10 independent samples in Mx1-cre control and Mx1-cre;Brd9fl/fl group, n = 8 independent samples in Mx1-cre;Brd9fl/wt group (both males and females). Mean and s.e.m are plotted. p values were calculated by two-sided t-test. Source data are provided as a Source Data file.

