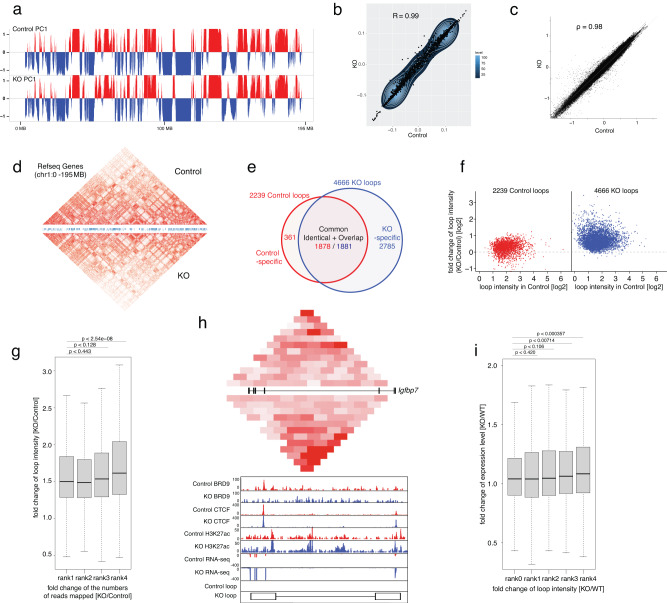
Fig. 6. The roles of BRD9/CTCF in chromatin three-dimensional organization.
a The global arrangement of active (red) and inactive (blue) compartments on chr1 in Control (top panel) and KO (second panel) cells. b Genome-wide comparison of the eigenvector values between Control (x axis) and KO (y axis) cells. c Genome-wide comparison of the insulation scores between Control (x axis) and KO (y axis) cells. d Comparison of TADs between Control and KO cells. A heatmap of the Knight-Ruiz balanced observed/expected interaction frequencies (loop intensities) on chr1 as (a) is compared between Control (upper portion) and KO (lower portion) cells. e Numbers of the chromatin loops detected in Control and KO cells. The numbers of common (identical and overlapped i.e., both anchors overlap), Control-specific and KO-specific loops are shown. f Fold change of loop intensities from Control to KO cells of chromatin loops detected in Control (left, red) and KO (right, blue) cells. X and y axes represent the loop intensities detected in Control and the fold change of loop intensities (KO/Control), respectively. g Relationship between loop intensity and CTCF enrichment in loop anchors. A boxplot of fold changes of loop intensities in KO relative to Control cells (KO/Control) for four groups of loops showing distinct levels of fold change of CTCT enrichment in KO relative to Control cells (KO/Control) is shown. The 5027 loops in the default set were ranked by the fold change of CTCT enrichment from low to high in rank 1 to rank 4 (each ~1257 loops). Hereinafter, the exact p values computed by two-sided Mann–Whitney tests are presented, and in each boxplot, bar indicates median, box edges first and third quartile values, and whisker edges minimum and maximum values. h Comparison of the profiles of contact frequencies, BRD9, CTCF, H3K27ac, and transcription around Igfbp7 locus between Control and KO samples. The combined mapping data presents HiC interaction frequencies, ChIP-seq profiles of BRD9, CTCF, and H3K27ac, and RNA expression on Igfbp7 locus in both Control and KO. The balanced HiC two-dimensional contact matrix is compared between Control (above) and KO sample (below) in top panel. The exon and intron structure of Igfbp7 is given in between. The color intensity presents represents level of interaction frequency computed at 5 kb resolution. ChIP-seq and RNA-seq profiles are presented below. The positions of loop anchors are shown at the bottom. The maximum y-axis value of ChIP-seq or RNA-seq signal is set as indicated. i Relationship between gene expression and loop intensity. A boxplot of fold changes of the expression level of one group of non-loop anchored genes and four groups of loop-anchored genes showing distinct levels of fold changes of loop intensities in KO relative to Control cells (KO/Control) is shown. In total, 1998 genes expressed (FPKM ≥ 0.5) in Control or KO cells were anchored by 1681 loops. A total of 2359 combinations of genes and loops were ranked by the fold change of loop intensities from low to high in rank 1 to rank 4 (each ~590 combinations). Rank 0 represents a group of 2402 non loop anchored genes, located outside of loops (of similar expression levels in Control and KO cells) The p values of rank 1 to 4 were computed against rank 0. The results here are based on biological triplicate of HiC, biological duplicate of BRD9, CTCF, and H3K27ac ChIP, and biological triplicate of RNA-seq datasets for each Control and KO sample. Source data are provided as a Source Data file.

