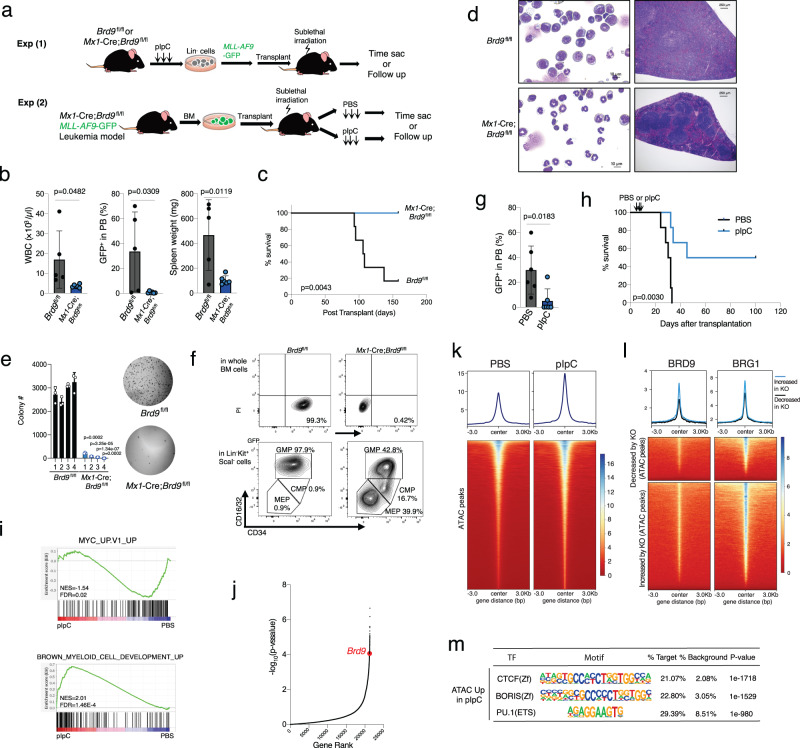
Fig. 7. BRD9 loss inhibited leukemia development and maintenance in vivo.
a Schema of two different transplant models for the development (Experiment 1) and the maintenance (Experiment 2) of MLL-AF9-induced AML. b WBC count, GFP+ rate in the PB, and spleen weight of Brd9fl/fl (n = 5 independent samples, males) and Mx1-Cre;Brd9fl/fl (n = 6 independent samples, males) recipient mice in Experiment 1. Error bars, means ± s.e.m. p value relative to control by a two-sided t-test. c Kaplan-Meier survival of each recipient group. p value was calculated by log-rank test. d Representative images of the BM cytospin (left) and spleen (right). Bar: 10 µm (left), 250 µm (right). e The number of colonies serially replated in methylcellulose M3434 (left). n = 3 independent experiments; mean and s.e.m are plotted. p value relative to control by a two-sided t-test. Representative images (right) of the second colony. f Representative FACS plots of data of GFP+ cells and of GMP, CMP, and MEP in Lin−c-Kit+ScaI− cells. g GFP positive rate in the PB live cells 14 days after pIpC injection. n = 6 independent samples, males; Error bars, means ± s.e.m. p value relative to control by a two-sided t-test. h Kaplan–Meier survival of each recipient group in Experiment 2 (PBS vs. pIpC). p value was calculated by log-rank test. i GSEA enrichment plot for MYC and myeloid development-associated genes in RNA-seq of pIpC-treated group vs. PBS-treated group. j Rank plot for the −log10 (p value) associated with each sgRNA in the screen using the murine AML model and negative-enrichment whole-genome CRISPR–Cas9 pooled lentiviral screen73 (p values were calculated using a Wilcoxon matched-pairs signed rank test). k The average ATAC peaks enrichment profile in PBS or pIpC-treated MLL-AF9 GFP+ BM cells. Heatmap illustrating the ChIP-seq signal 3 kb up and downstream. l The average ChIP enrichment profile of BRD9 and BRG1 in the cluster of decreased by KO (top) and increased by KO (bottom) shown in Supplementary Fig. 4f. m Transcriptional factor motif analysis of increased ATAC peaks in pIpC-treated KO group. Source data are provided as a Source Data file.

