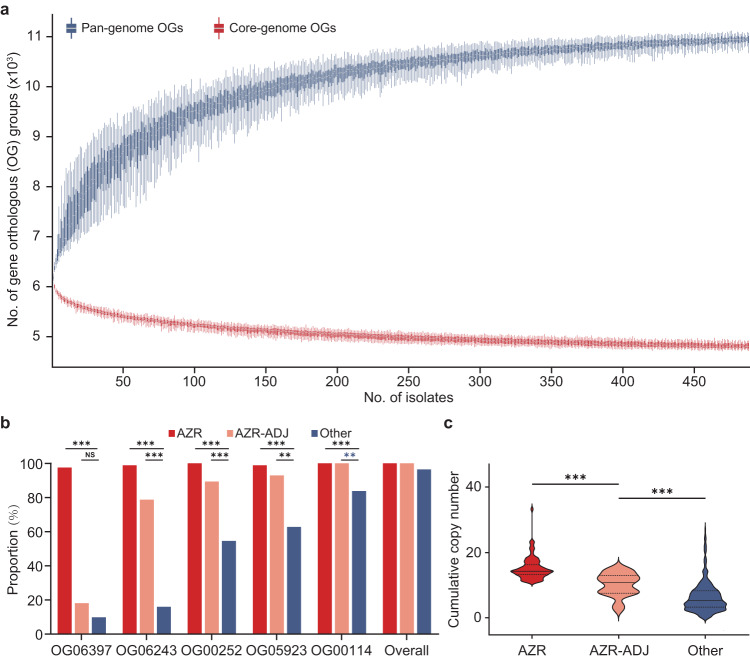
Fig. 9. Characterization of Ty3/gypsy-like retrotransposons enriched in cluster AZR isolates.
a Characteristics of the C. tropicalis pan-genome and core genome. The y-axis indicates the sizes of the pan-genome and core genome (with the number of predicted gene orthologous groups [OGs]), and the x-axis is the number of C. tropicalis strains incorporated for analysis. Box-and-whisker plots were used, with upper and lower whiskers represent maximum and minimum values, respectively. The hinges of the box represent 25% to 75% percentiles and the horizontal line within the box represents median values. b Comparison of proportions of isolates carrying different Ty3/gypsy-like retrotransposons among cluster AZR, group AZR-ADJ and other phylogenetic populations. NS, not significant; **p-values < 0.01. ***p-values < 0.001. c Comparison of the cumulative number of Ty3/gypsy-like retrotransposons in different phylogenetic populations (shown as a bar-plot with median and interquartile range), which indicates that Ty3/gypsy-like retrotransposons are significantly more enriched in cluster AZR isolates. ***p-values < 0.001.

