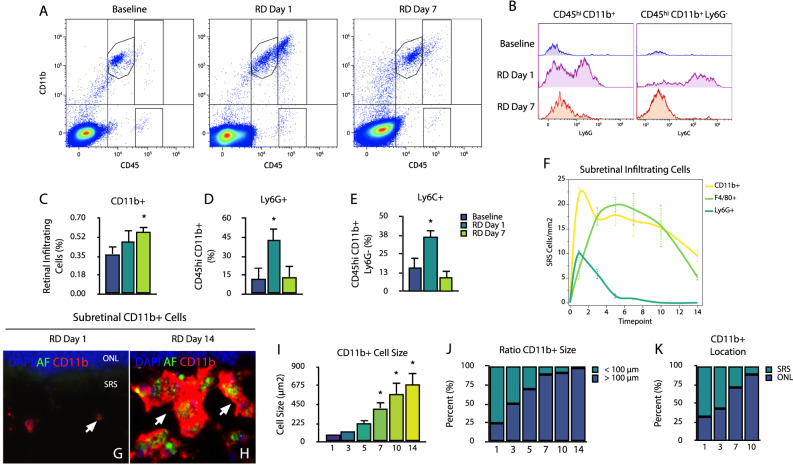
Fig. 3. Immunophenotyping of infiltrating cells in retinal detachment.
A Density plots and gating strategy from single-cell suspensions of live CD45 CD11b-infiltrating cells at baseline, days 1 and day 7 after retinal detachment. B Histogram overlays of CD45hi CD11b+ Ly6G+ and CD45hi CD11b+ Ly6G− Ly6C+ cells. C–E Quantitative analyses of total CD11b+, CD45hi CD11b+ Ly6G+, and CD45hi CD11b+ Ly6G− Ly6C+(pooled samples, n = 6 per replicate). F Quantitation of subretinal cells in the subretinal space of whole-eye cryosection images (n = 4 per group). Images are representative of ≥2 experiments. G and H Representative retinal cryosection image of subretinal CD11b+ cells at day 1 and 14, showing cell size increase (n = 4, 4). I Subretinal CD11b+ cell size ratio thorough days 1–14 after detachment. J Ratio of CD11b+ >100 µm2 area. K Location of subretinal CD11b+ in the subretinal space (SRS) or in contact with the outer nuclear layer (ONL) (n = 4 per group). *p < 0.05.

