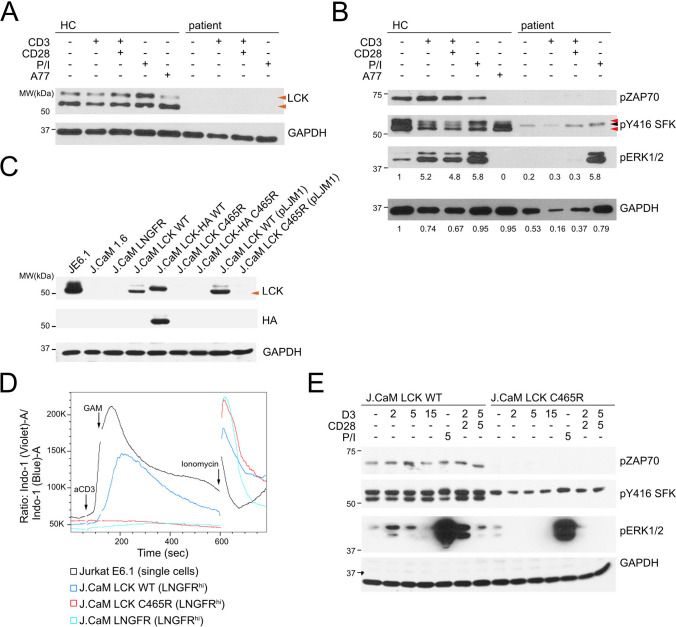
Fig. 2.
Reduced protein expression and TCR signaling due to LCK C465R. A LCK and GAPDH immunoblots of whole cell lysates of patient or healthy control (HC) T-cell blasts unstimulated or stimulated with anti-CD3 (2 min), anti-CD3/CD28 (2 min), PMA/ionomycin (P/I, 5 min) or treated with the selective LCK-inhibitor A770041 (A77, 10 min). Orange arrowheads indicate LCK bands. B pZAP70, pSFK (pY416), pERK1/2 or GAPDH immunoblots, conditions as in A. Red arrowheads indicate pLCK bands, black arrowheads pFYN-T. Numbers below pERK1/2 blot indicate fold change pERK1/2 band intensity (HC unstimulated =1), intensity normalized to GAPDH loading (numbers below GAPDH blot; GAPDH signal intensity normalized to HC unstimulated) C LCK, HA-tag and GAPDH immunoblots of whole cell lysates of Jurkat E6.1, J.CaM1.6, and stable transduced cells line expressing either LCK WT or LCK C465R with or without on C-terminal HA-tag or transduced with pCDH containing only the expression cassette for the extracellular domain of the low-affinity nerve growth factor receptor (LNGFR) (J.CaM EV). D Overlay of Ca2+-flux measurement in the indicated cell lines. Experiment representative of 3 independent experiments. E pZAP70, pSFK (pY416), pERK1/2 immunoblots in J.CaM1.6 cells transduced with pLJM1 containing LCK WT or LCK C465R and stimulated with either anti-CD3 (2, 5 or 15 min), anti-CD3/CD28 (2 or 5 min), PMA/ionomycin (5 min) or left untreated

