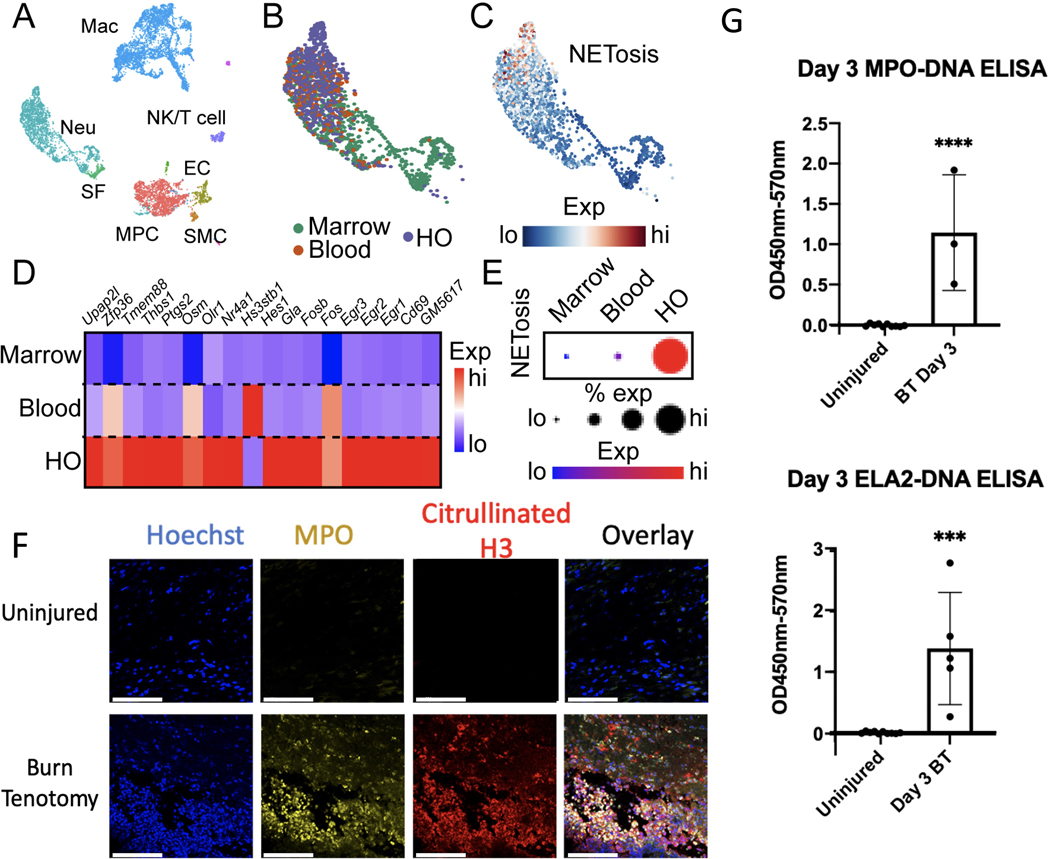
Figure 1. NET formation is stimulated by HO inducing injuries.
(A) UMAP plot of single cell RNA sequencing from cells harvested from the injury site (HO), blood, and tibial bone marrow 3 days post-BT injury, identifying multiple clusters. Single cells are represented by individual points. (B) UMAP plot of neutrophils colored by anatomical origin. (C) Feature plot of neutrophil expression of induced NETosis genes. Neutrophils with higher average expression of induced NETosis genes are red. (D) Heatmap showing average expression of individual genes upregulated in induced NETosis in neutrophils split by anatomical location. (E) Dot plot of overall expression of induced NETosis genes in neutrophils split by anatomical location. Dot size indicates percent of neutrophils expressing induced NETosis genes. Color indicates degree of expression, with red being high. (F) Immunofluorescent microscopy of the HO site at day 3 post-injury in an uninjured and burn/tenotomy. (G) Quantification of injury site MPO and ELA2 ELISAs in uninjured mice (n=10) as compared mice who underwent a burn/tenotomy (n=3/5). Scale bar represents 100 μm. (*** indicates p <0.001, **** p < 0.0001).

