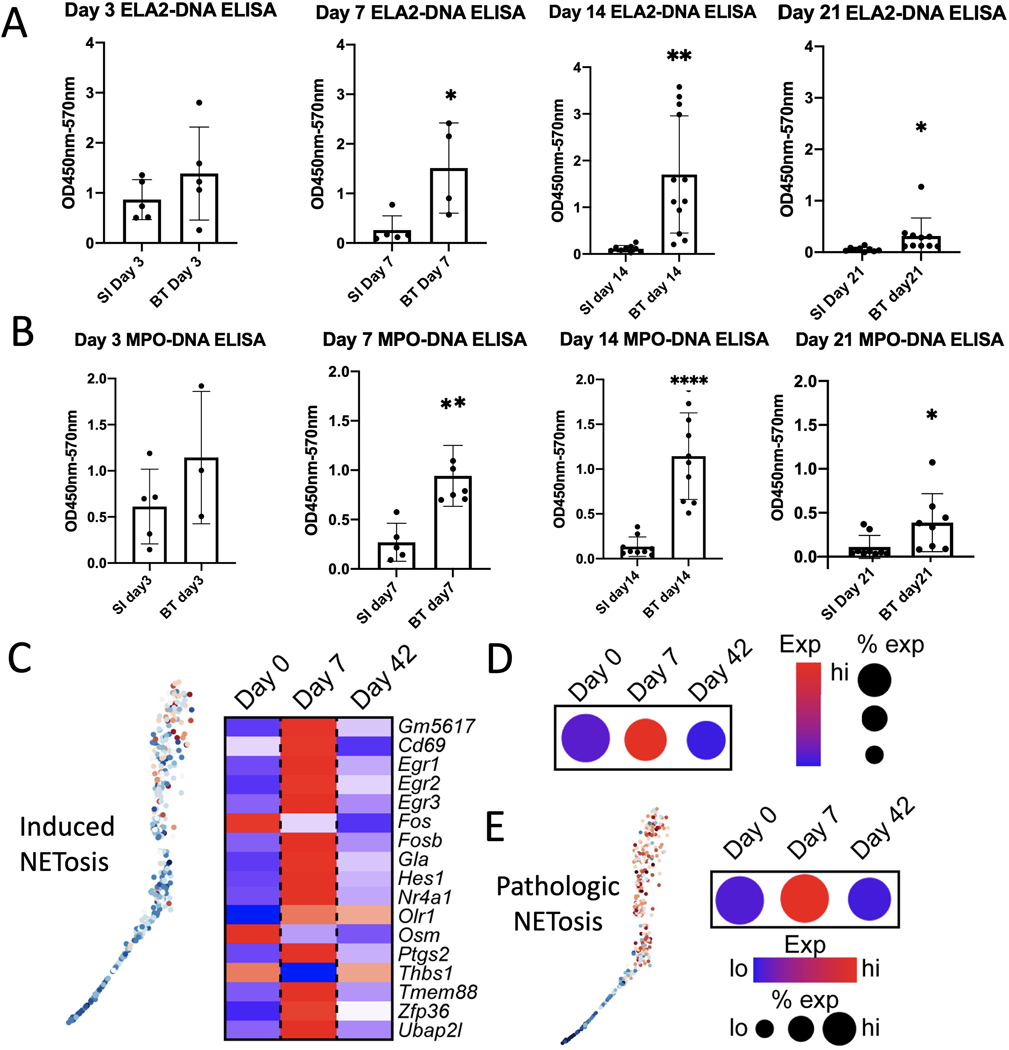
Figure 2. NETosis analysis to detect early HO formation.
Quantification of (A) ELA2-DNA ELISAs and (B) MPO-DNA ELISA done on cell lysate of the injury site following a non-HO forming burn and skin incision or a HO inducing burn/tenotomy injury at days 3, 7,14 and 21 (n=3–6/group). (C) Feature plot (left) and heatmap (right) of neutrophils harvested from the HO injury site of mice 0 days, 7 days, and 42 days post-BT injury showing expression of induced NETosis genes. Neutrophils with higher average expression of induced NETosis genes are red (left). (D) Dot plot of overall expression of induced NETosis genes in neutrophils split by timepoint. Dot size indicates percent of neutrophils expressing induced NETosis genes. Color indicates degree of expression, with red being high. (E) Feature plot (left) and dot plot (right) of neutrophils harvested from the HO injury site of mice 0 days, 7 days, and 42 days post-BT injury showing expression of pathologic NETosis genes. Neutrophils with higher average expression of pathologic NETosis genes are red (left). Dot size indicates percent of neutrophils expressing pathologic NETosis genes. Color indicates degree of expression, with red being high (right). (* = p<0.05, ** = p<0.01, ****p<0.001). Stars indicate a significant increase as compared to the non-HO forming burn and skin incision.

