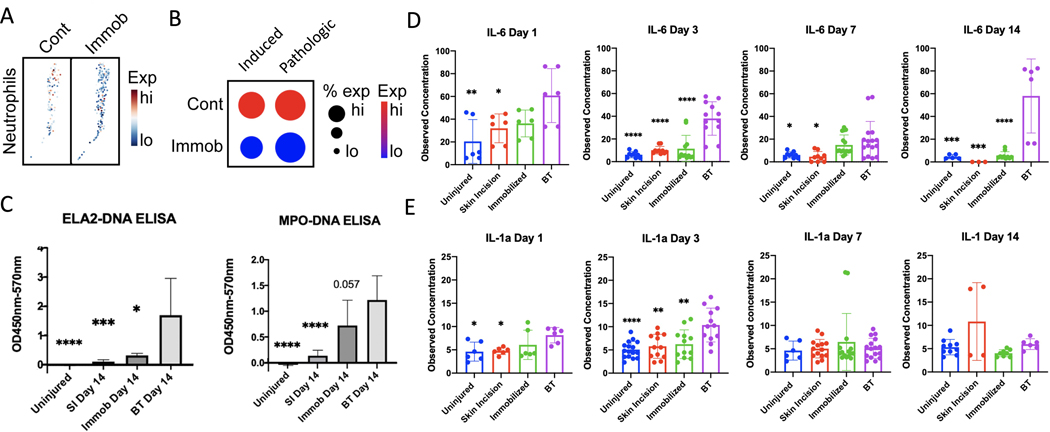
Figure 3. Immobilization effect on Injury Site NETosis and Serum Cytokines.
(A) Feature plot of neutrophils harvested from the HO injury site of mice 7 days post-BT injury from mobilized (control) and immobilized conditions, displaying expression of induced NETosis genes. Neutrophils with higher average expression of induced NETosis genes are red. (B) Dot plot of neutrophil expression of induced NETosis genes and net expression of pathologic NETosis genes. Dot size indicates percent of neutrophils expressing NETosis genes. Color indicates degree of expression, with red being high. (C) Quantification of ELA2-DNA ELISAs and MPO-DNA ELISAs done on day 14 cell lysate of the injury site following no injury, non-HO forming burn and skin incision (SI), HO inducing BT injury or HO inducing BT with post-injury hindlimb immobilization. (D) Quantification of mouse serum IL-1α and (E) IL-6 at days 1, 3, 7, and 14 following no injury, non-HO forming burn and (SI), HO inducing BT injury or HO inducing BT with post-injury hindlimb immobilization. * = p<0.05, ** = p<0.01, ***p<0.001, ****p<0.0001. Stars indicate a significant decrease as compared to the BT.

