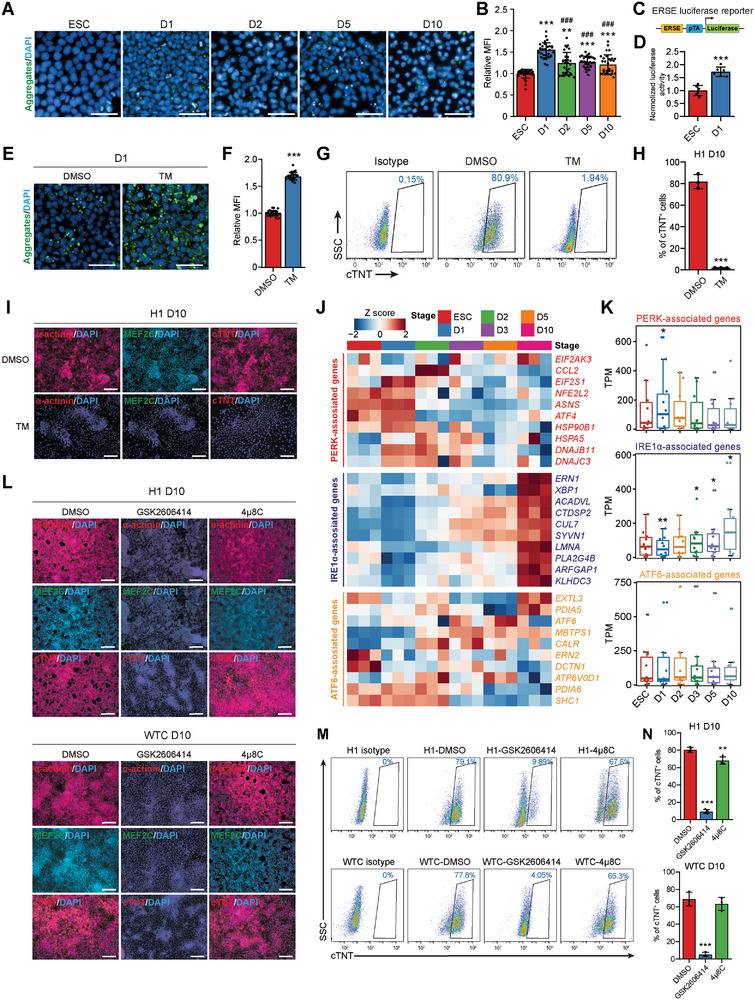
Figure 1.

Transient unfolded protein accumulation accompanied by the activation of PERK at the early stage of CM differentiation. A) Representative immunofluorescence analyses of cells at each stage of CM differentiation of H1 hESCs stained with Proteostat (green, protein aggregates). D,differentiation day. Scale bars, 50 µm. B) Quantitative mean fluorescence intensity (MFI) of the protein aggregates normalized to the cell number in samples in (A). n = 3 biologically independent experiments, ten fields of view per experiment. *** P<0.001 versus ESC; ### P < 0.001 versus D1. C) Schematic of the ER stress element (ERSE) luciferase reporter construct. D) Quantitative analyses of ERSE‐luciferase activity in ESC and D1 cells. n = 6 biologically independent experiments. *** P<0.001 versus ESC. E,F) Representative E) and quantitative F) immunofluorescence analyses of the protein aggregates in D1 cells treated with DMSO or tunicamycin (TM) during differentiation. n = 3 biologically independent experiments, 10 fields of view per experiment. *** P<0.001 versus DMSO. Scale bars, 50 µm. G,H) Representative G) and quantitative H) flow cytometric analyses of cTNT+ cells in D10 cultures treated with DMSO or TM during differentiation. n = 3 biologically independent experiments. *** P<0.001 versus DMSO. I) Immunofluorescence analyses of CM markers α‐actinin, MEF2C, and cTNT in D10 cultures treated with DMSO or TM during differentiation. Scale bars, 200 µm. J) Heatmap showing the expression levels of PERK‐, IRE1α‐, and ATF6‐associated genes during CM differentiation of H1 hESCs revealed by RNA‐seq. n = 3 biologically independent experiments. K) Expression levels of PERK‐, IRE1α‐, and ATF6‐associated genes during CM differentiation of H1 hESCs revealed by RNA‐seq. * P<0.05, ** P<0.01 versus ESCs. L) Immunofluorescence analyses of CM markers α‐actinin, MEF2C, and cTNT in H1 hESC‐ and WTC hiPSC‐derived D10 cultures treated with DMSO, GSK2606414 (PERK inhibitor), or 4µ8C (IRE1α inhibitor) during differentiation. Scale bars, 200 µm. M,N) Representative M) and quantitative N) flow cytometric analyses of cTNT+ cells in H1 hESC‐ and WTC hiPSC‐derived D10 cultures treated with DMSO, GSK2606414, or 4µ8C during differentiation. n = 4 (H1) or 3 (WTC) biologically independent experiments. ** P<0.01, *** P<0.001 versus DMSO. Data represent mean ± SD. Statistical significance was determined by one‐way ANOVA with a post‐hoc Tukey test B,N), unpaired two‐tailed t‐test D, F, and H), and Wilcoxon test K).
