
Figure 6.
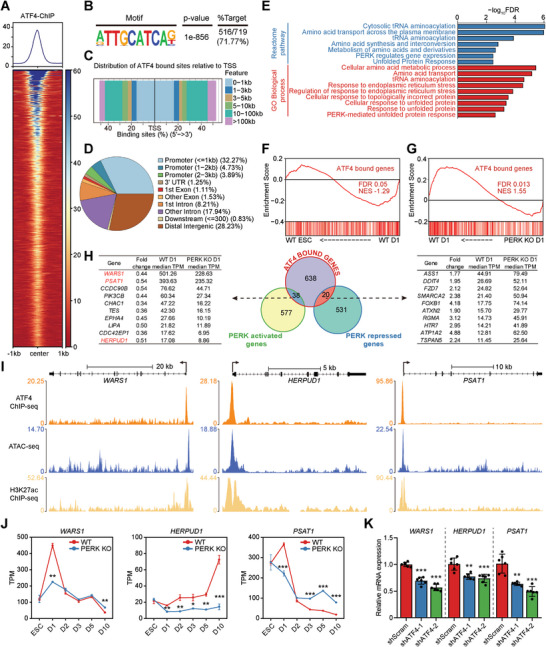
Genome‐wide occupancy of ATF4 in mesendoderm cells. A) ChIP‐seq signal heatmap of ATF4 in mesendoderm cells at D1 using a ±1 kb window centered on peak regions. ChIP‐seq signal was sorted in descending order by signal intensity. B) Motif enriched at ATF4 bound sites in mesendoderm cells at D1. C) Distribution of the distance of ATF4 bound sites relative to the transcriptional start sites in mesendoderm cells at D1. D) Fractions of genomic annotations of ATF4 bound sites in mesendoderm cells at D1. E) GO and Reactome Pathways enrichment analysis of the nearest neighboring genes of ATF4 bound sites. F,G) GSEA of the RNA‐seq data from WT ESCs and WT D1 mesendoderm cells F), as well as WT and PERK KO mesendoderm cells at D1 G). Set of the nearest neighboring genes of ATF4 bound sites, terms as “ATF4 bound genes” is used. H) Venn diagram (middle panel) outlining the overlap between genes positively and negatively regulated by PERK and ATF4 bound sites in mesendoderm cells at D1. Representative overlapping genes and their expression levels are represented in the left and right panel. I) Genome browser view showing the tracks of ATF4 ChIP‐seq, H3K27ac ChIP‐seq, and ATAC‐seq signals at the WARS1, HERPUD1, and PSAT1 gene loci, as indicated. J) Expression levels of WARS1, HERPUD1, and PSAT1 during CM differentiation of WT and PERK KO hESCs revealed by RNA‐seq. n = 3 biologically independent experiments. * P<0.05, ** P<0.01, *** P<0.001 versus WT. K) RT‐qPCR analysis of WARS1, HERPUD1, and PSAT1 in shScram control and ATF4 KD mesendoderm cells at D1. n = 6 biologically independent experiments. ** P<0.01, *** P<0.001 versus shScram. Data represent mean ± SD. Statistical significance was determined by unpaired, two‐tailed t‐tests J) and one‐way ANOVA with a post‐hoc Tukey test K).