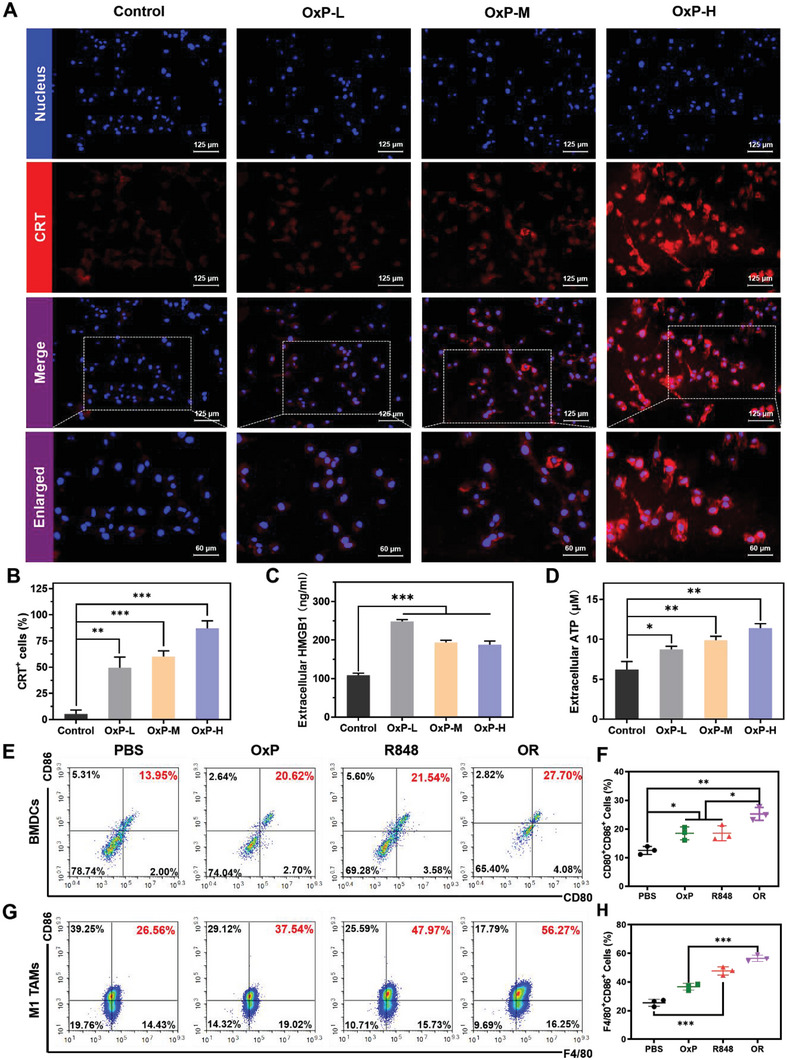
Figure 5.

Immunological analysis of OxP and R848. A,B) Immunofluorescence of CRT and the percentage of CRT+ cells (n = 3). C,D) Content of HMGB1 and ATP in culture supernatant (n = 3). E,F) Flow cytometry of CD80 and CD86 on the BMDCs (n = 3). G,H) Proportion of M1 phenotype Raw264.7 cells after different treatments (n = 3). Data are presented as mean ± SD. P values were determined by Student's t‐test and one‐way ANOVA with Tukey's test (*p < 0.05, **p < 0.01, ***p < 0.001).
