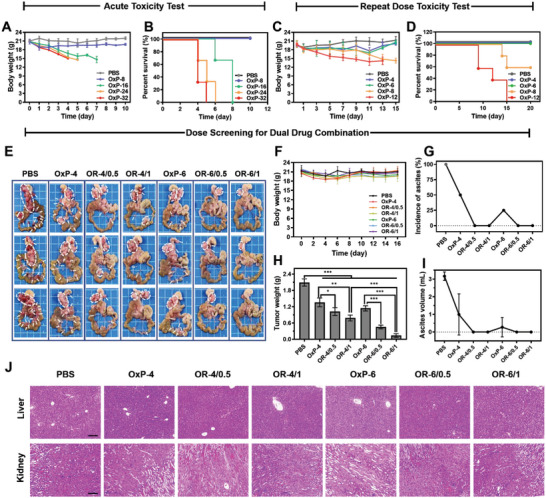
Figure 6.

Dose optimization of OxP/R848@PLEL in PM treatment. A,B) Changes of body weight and survival of mice in OxP@PLEL acute toxicity test (n = 3). C,D) Changes in body weight and survival of mice in OxP@PLEL repeated administration toxicity test (n = 5). E) Photographs of PM in dose screening for dual combination. F–I) Changes in body weight, tumor weight, the incidence of ascites, and ascites volume (n = 4). J) H&E staining of liver and kidney tissues of each group. Scale bars: 200 µm. Data are presented as mean ± SD. P values were determined by Student's t‐test and one‐way ANOVA with Tukey's test (*p < 0.05, **p < 0.01, ***p < 0.001).
