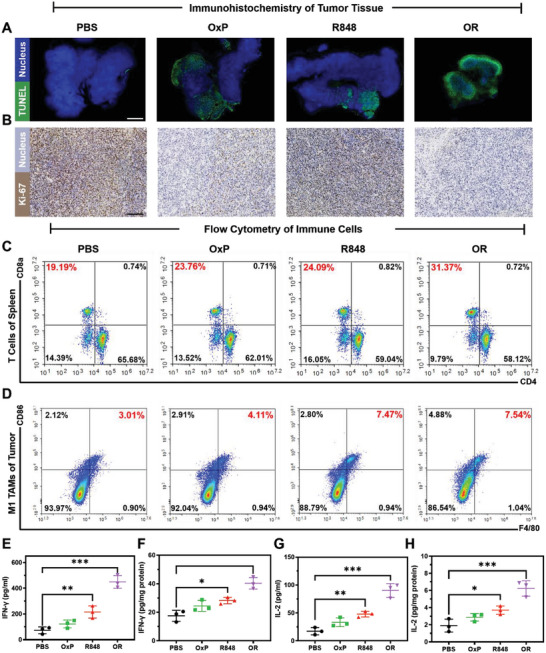
Figure 9.

Anti‐tumor mechanism of OxP/R848 in vivo. A) TUNEL test of tumor apoptosis in each group. Scale bars: 1.25 mm. B) Proliferation of tumor detected by Ki‐67 staining. Scale bars: 150 µm. C) CD3+CD8+ T cells and CD3+CD4+ T cells in the spleen (n = 3). D) Proportion of M1‐TAMs in TME in different administration groups (n = 3). E) The level of IFN‐γ in serum of mice in each group (n = 3). F) IFN‐γ levels in the TME of mice in each group (n = 3). G) The level of IL‐2 in serum of mice in each group (n = 3). H) IL‐2 levels in the TME of mice in each group (n = 3). Data are presented as mean ± SD. P values were determined by Student's t‐test (*p < 0.05, **p < 0.01, ***p < 0.001).
