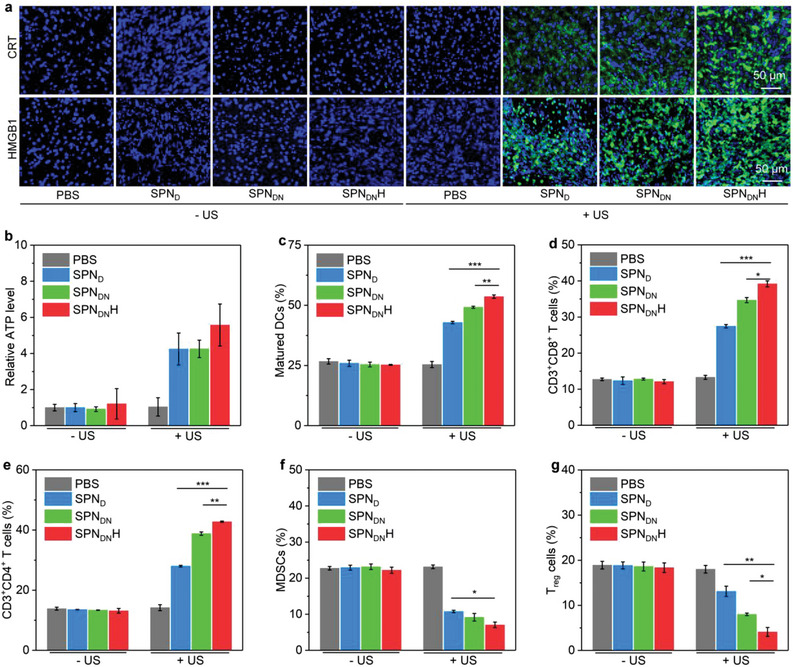
Figure 7.

In vivo ICD effect and immunological effect evaluation. a) Confocal fluorescence images of CRT and HMGB1 staining of orthotopic pancreatic tumors. b) ATP levels in orthotopic pancreatic tumors in each group (n = 5). c) Contents of matured DCs (n = 5). d) Contents of intratumoral CD3+CD8+ T cells (n = 5). e) Contents of intratumoral CD3+CD4+ T cells (n = 5). f) Contents of intratumoral MDSCs (n = 5). g) Contents of intratumoral T reg cells (n = 5). Data are presented as means ± SD, and the significant differences were analyzed by two‐tailed unpaired t test, *p < 0.05, **p < 0.01, ***p < 0.001.
