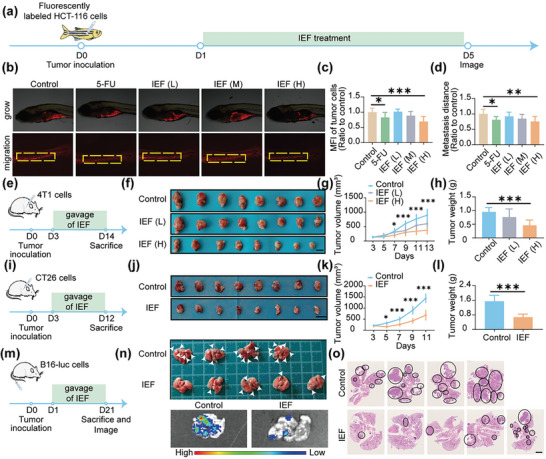
Figure 4.

Anti‐tumor and anti‐tumor metastatic effects of IEF in zebrafish and mice. a) Scheme illustrating of anti‐tumor and anti‐tumor metastasis by IEF in zebrafish tumor xenografts models. b) Representative pictures of fluorescence images in PVS. c,d) Quantitative values of fluorescence intensity (c), and migration distance of HCT‐116 cells (d) (n = 8). e) Scheme of anti‐tumor process by IEF in subcutaneous 4T1 mouse tumor models. f) Photographs of tumors treated with different concentrations of IEF. Scale bar, 1 cm. g,h) Tumor growth curve (g), and tumor weights (h) of 4T1 tumor‐bearing mice (n = 8). i) Scheme of anti‐tumor process by IEF in subcutaneous CT26 mouse tumor models. j) Photographs of tumors treated with IEF. Scale bar, 2 cm. k,l) Tumor growth curve (k), and tumor weights (l) of CT26 tumor‐bearing mice (n = 8). m) Scheme of anti‐tumor metastasis process by IEF in melanoma lung metastasis mice models. n) Pictures and fluorescent imaging of mouse lung metastasis tumors obtained from day 21 (n = 5). o) H&E staining of lung tumors. Scale bar, 2.5 mm. The data are shown as the mean ± s.d. One‐way ANOVA, * p < 0.05, ** p < 0.01, *** p < 0.001.
