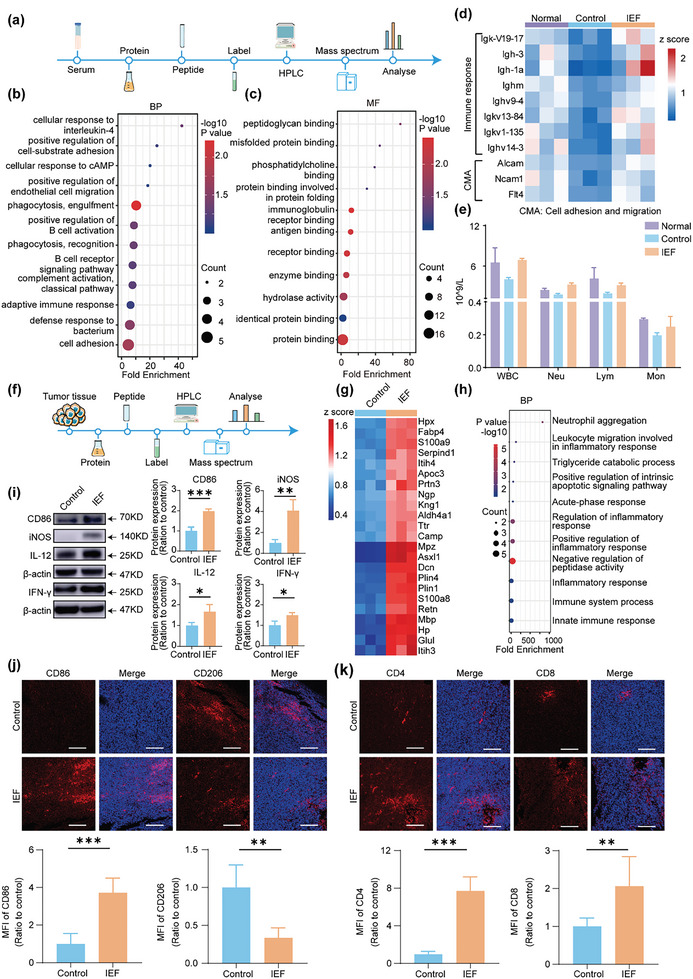
Figure 7.

IEF treatment boost tumor immunity. a) Scheme of serum proteomics. b) Annotation of GO for BP in serum. c) Annotation of GO for MF in serum. d) Heat map of differential expression proteins in serum (fold change, >1.2 or <0.8; p < 0.01, n = 3). e) Routine blood tests for WBC, including neutrophils (Neu), lymphocytes (Lym), monocytes (Mon). f) Scheme of tumor proteomics process. g) Heat map of differential proteins in tumor tissues (fold change, >1.5 or <0.5; p < 0.01, n = 3). h) Annotation of GO for BP in tumor. i) WB assay and quantitative protein expressions of M1‐tpye macrophages related makers (iNOS, IL‐12, CD86 and IFN‐γ) in tumor (n = 3). j) Representative pictures and quantitative analysis of immunofluorescence staining for M1‐type macrophages (labeled by CD86) and M2‐tpye macrophages (labeled by CD206) in tumor (n = 5). MIF: mean immunofluorescence. Scale bar, 150 µm. k) Representative pictures and quantitative analysis of immunofluorescence staining for CD4+ T cells and CD8+ T cells staining in tumor (n = 5). Scale bar, 150 µm. Images were representative of four biologically independent mice in each group. The data are shown as the mean ± s.d. Student's t‐test, * p < 0.05, ** p < 0.01, *** p < 0.001.
