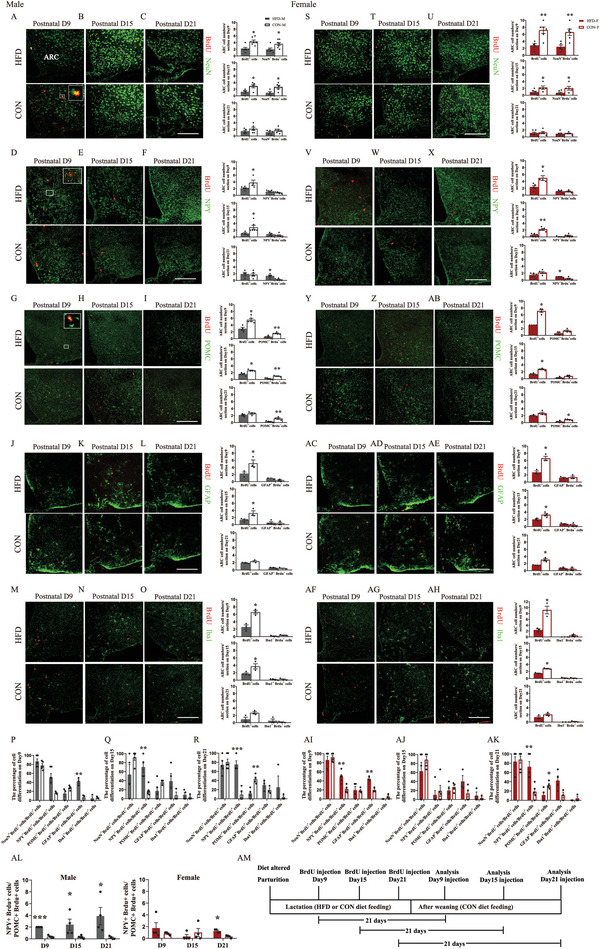
Figure 5.

The destiny of newborn cells in hypothalamic ARC regions of early postnatal offspring is affected by maternal HFD feeding during lactation. A–O) Representative images (left panels) and quantification analysis (right panels) of the fate of the newborn cells labeled by BrdU in male pups injected with BrdU on postnatal day 9, day 15, and day 21, and the analysis was performed at 21 days after BrdU injection. Colocalization of A–C) NeuN, D–F) NPY, G–I) POMC, J–L) GFAP, M‐O) Iba1 with BrdU (n = 3–6). P–R) The percentage of BrdU+ cells differentiated to cells labeled with NeuN, NPY, POMC, GFAP, or Iba1 to total BrdU+ cells in male pups injected with BrdU on postnatal P) day 9, Q) day 15, and R) day 21 (n = 3–6). S‐AH) Representative images (left panels) and quantification analysis (right panels) of the fate of the newborn cells labeled by BrdU in female pups injected with BrdU on postnatal day 9, day 15, and day 21, and the analysis was performed at 21 days after BrdU injection. Colocalization of S–U) NeuN, V‐X) NPY, (Y‐AB) POMC, (AC–AE) GFAP, (AF–AH) Iba1 with BrdU (n = 3–6). AI–AK) The percentage of BrdU+ cells differentiated to cells labeled with NeuN, NPY, POMC, GFAP, and Iba1 to total BrdU+ cells in female pups injected with BrdU on postnatal (AI) day 9, (AJ) day 15, and (AK) day 21 (n = 3–6). AL) The ratio of BrdU+ cells differentiated to NPY neurons to BrdU+ cells differentiated to POMC neurons in both males (left) and females (right) (n = 4). AM) Schematic diagram of the experimental protocol for the analysis of early postnatal newborn cell fate. Scale bars, 100 µm. Values are represented as mean ± SEM and analyzed by unpaired Student's t‐test. Differences with p < 0.05 were considered significant. *p < 0.05, **p < 0.01.
