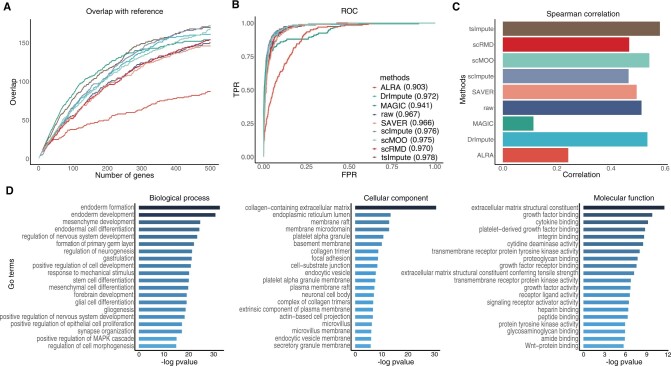
Figure 5.
DE analysis results of raw data and different imputation methods. (A) Overlap of the single-cell DE genes and reference bulk DE genes. (B) ROC curves and corresponding AUC values of different imputation methods. (C) Spearman correlation between adjusted P values derived from bulk data and single cell data. (D) Statistically significant GO terms identified with ClusterProfiler, which are divided into three categories, i.e. biological process, cellular component, and molecular function.

