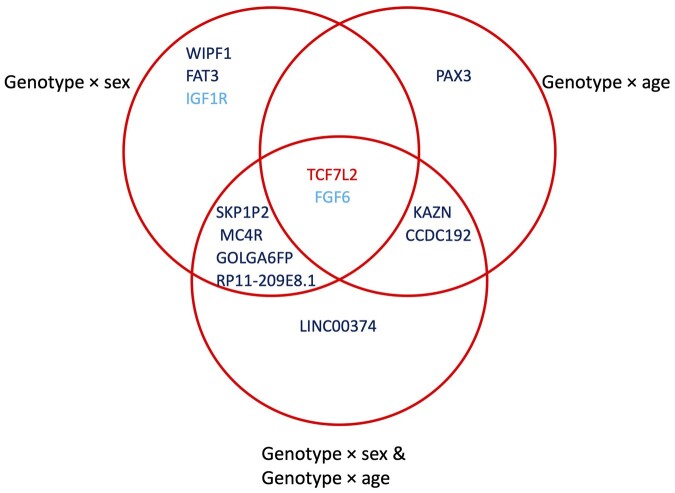
Figure 3.
Results from multi-exposure GWIS for incident T2D in the ProDiGY youth cohort. Venn diagram displays overlap between loci discovered at genome-wide significance using the joint test of genetic and interaction effects (pjoint = 5 × 10⁻⁸), from each of: sex-only, age-only, and multi-exposure (sex and age) analyses. Variants are labeled according to the closest gene, and colors correspond to the test(s) in which significance was achieved: marginal genetic effect (light blue), joint genetic effect (dark blue), or both joint and marginal genetic effects (red).

