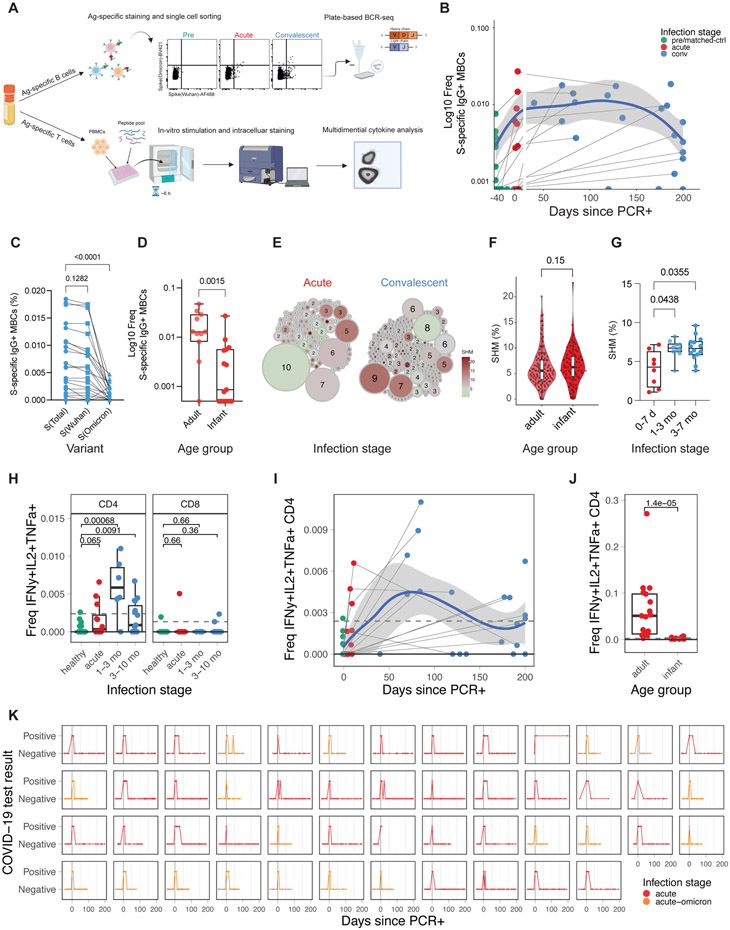
Figure 2. Transient memory B and T-cell response to COVID-19 infection in infants and young children.
A) Experiment overview. B) Frequency of SARS-CoV-2 spike-specific IgG+ memory B-cells as a proportion of CD20+ B-cells (infants and young children: pre n=12, acute n=12, conv n=21). Blue line indicates average; shaded areas indicate 5th to 95th percentiles. C,D) Frequency of spike-specific IgG+ memory B-cells in C) infants and young children at convalescent phase and D) at acute phase in adults (mild/moderate infection n=11) and infants and young children (non-omicron n=12, omicron n=3). E) Clonality analysis of sorted spike-specific IgG+ memory B-cells in infants and young children (n=220). Circle size indicates the number of IGHV sequences; color represents the mean IGHV somatic hypermutation rate. F) Somatic hypermutation rates of IGHV genes in single sorted spike-specific IgG+ memory B-cells at acute phase. G) Mean somatic hypermutation rate of all cloned IGHV genes in indicated infant samples. H) Fraction of spike-specific multifunctional T-cells (IFNg+, IL-2+, TNFa+) at different infection stages. I) Kinetics of multifunctional CD4+ T-cell response. J) Comparison of multifunctional CD4+ T-cell response during the acute phase of infection in infants and young children and adults. K) Longitudinal overview of weekly COVID-19 test results from infant nasal swabs (Non-Omicron n=32, Omicron n=18). Statistical comparisons were conducted with Wilcoxon rank sum test. Solid line indicates median healthy response; dashed line indicates 3x median healthy response. See also Figure S2

