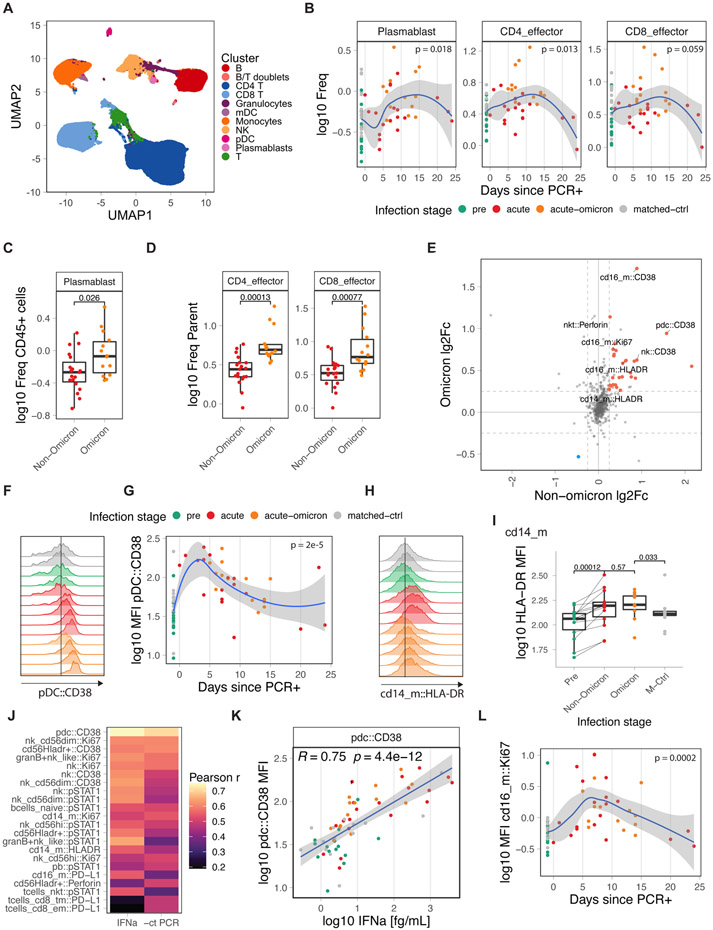
Figure 4. Immune cell activation during COVID-19 infection.
A) UMAP overview of cell clusters identified by CyTOF (n: pre=14, acute=19, acute-omicron=14, conv=14, matched-ctrl=14). B) Frequency of plasmablasts and effector T-cells as a proportion of total CD45+ and total T-cells, respectively. C, D) Comparison of plasmablast and effector T-cell frequencies in infants and young children. E) Average log fold-change of marker expression levels in healthy and infected samples. Markers that are significantly changed in Omicron and Non-Omicron cases are colored. F) Distribution of CD38 expression in pDCxs in representative samples. G) Kinetics of CD38 expression in pDCs. H) Distribution of HLA-DR expression in classical monocytes (CD14_m) in representative samples. I) HLA-DR expression in classical monocytes (CD14_m). J) Pearson r for correlations between CyTOF marker expression and plasma IFNα2 levels or viral load (−1 * Ct). K) Scatter graph plotting plasma IFNα2 levels against CD38 expression in pDCs. L) Kinetics of Ki67 expression in non-classical monocytes (cd16_m). Statistical comparisons were conducted with the Wilcoxon rank sum test. Correlation analyses were conducted using Pearson correlation. Lines were fitted using the loess (B,G,L) and linear regression (K) approaches. See also Figure S4

