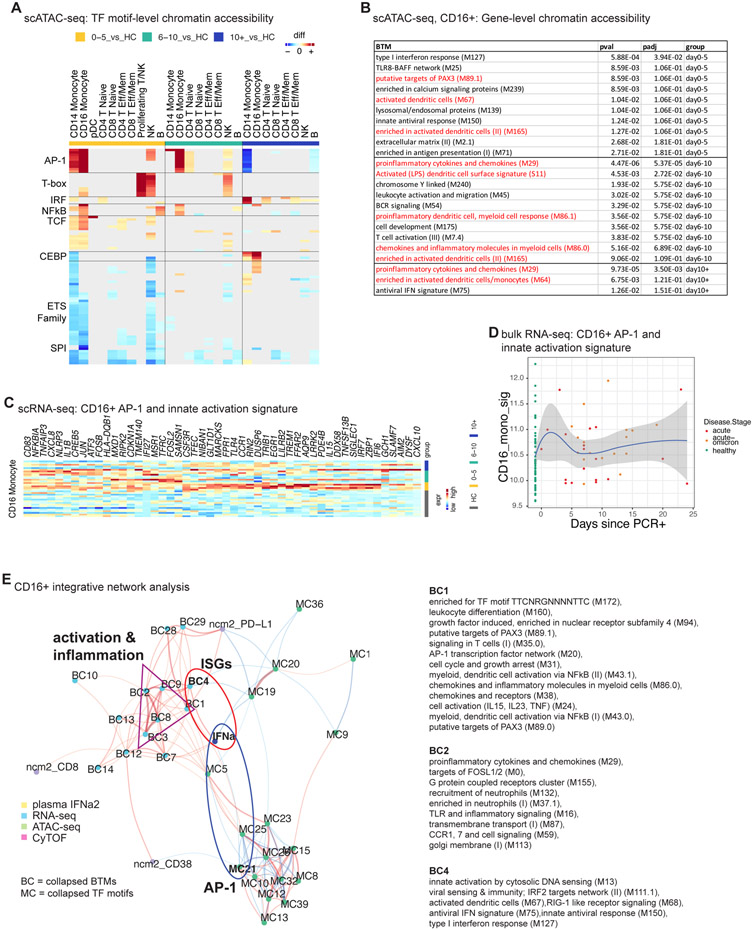
Figure 6. Single-cell multi-omics analysis of CD16+ monocyte activation.
A) Pairwise comparison of TF motif accessibility (healthy: n=16; D0-5: n=5, D5-10: n=7, D10+: n=6). Color indicates differences in TF accessibility; non-significant changes (FDR>=0.001 or changed in less than three subjects) are grey. B) Enrichment of BTMs in differentially accessible gene scores in CD16+ monocytes at indicated time points. C) Expression of inflammation and AP-1-related genes enriched in CD16+ monocytes in Figure 5c (blue box). D) Kinetics of gene signature from (C) using bulk transcriptomics data (healthy: n=53, acute: n=19, acute-omicron: n=18). E) Integrated network analysis of plasma IFNα2 levels, BTM-based gene expression, TF motif accessibility, and CyTOF protein marker expression. Both line color and thickness indicate Spearman's rank correlation coefficient. See also Figure S6

