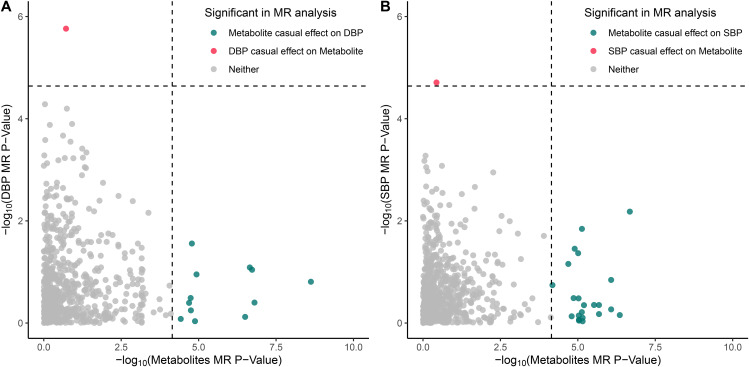
Fig. 3.
Bidirectional Mendelian randomization analysis supports causal associations for blood metabolites on hypertension and vice versa. (A) Comparison of bidirectional two-sample MR -log10 (p-values) for the 707 metabolites that could be investigated in both directions, where the x-axis indicates the p-value for a causal effect of blood metabolites on DBP and the y-axis indicates the p-value for a causal effect of DBP on blood metabolites. (B) Comparison of bidirectional two-sample MR -log10 (p-values) for the 703 metabolites that could be investigated in both directions, where the x-axis indicates the p-value for a causal effect of blood metabolites on SBP and the y-axis indicates the p-value for a causal effect of SBP on blood metabolites. Significant metabolites as indicated in the legend, while the dashed lines indicate significant threshold after Bonferroni correction

