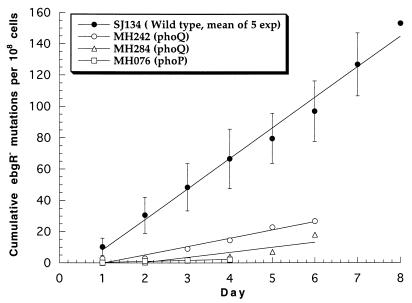
FIG. 2.
Cumulative ebgR mutations per viable cell during selection on lactulose minimal medium at 30°C. Symbols indicate the days on which the mutations occurred. Mutant colonies appeared either 3 days (SJ134) or 4 days (other strains) after mutations occurred (see text). Lines are least-squares fit to the data points. For strain SJ134, symbols indicate mean values for five independent experiments and error bars indicate the standard errors of those values.

