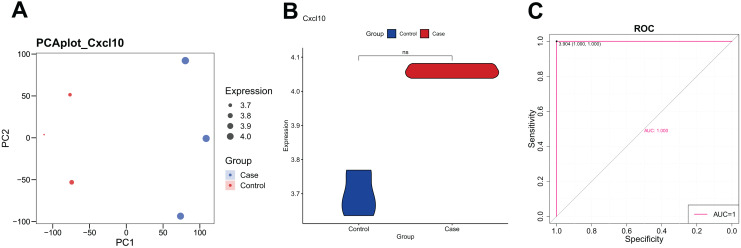
Figure 1. The expression of CXCL10 in polycystic ovarian failure (POF) is dysregulated.
(A) Principal component analysis (PCA) expression. Larger points on the diagram represent higher expression values. In PCA, data dimensionality of the data set was reduced, allowing the creation of a two-dimensional scatter plot for an initial sample distribution assessment. (B) ViolinPlot of the transcription levels of CXCL10 in POF and control; (C) receiver operating characteristic (ROC) curve analysis of CCXCL10.

