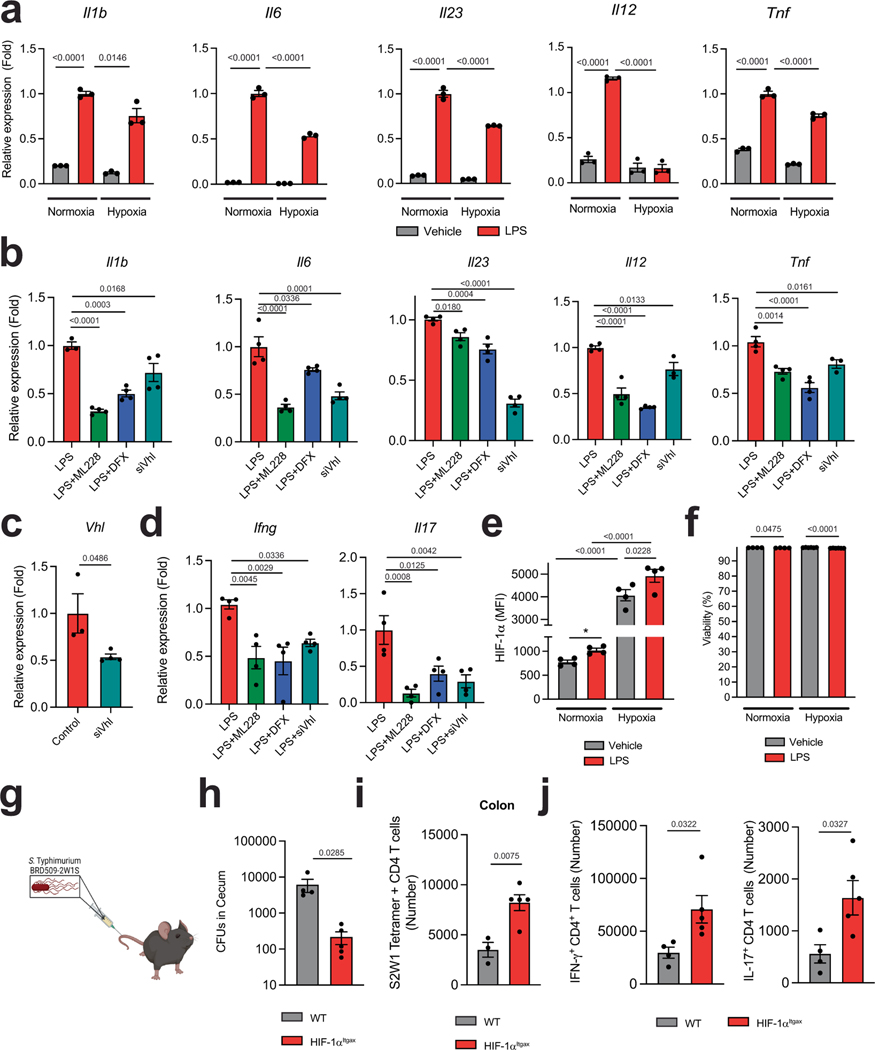
Extended Data Fig. 2 |. Effects of HIF-1α in DCs.
a, mRNA expression of shown genes in BMDCs isolated from WT mice treated with either vehicle or LPS and subjected to normoxia or hypoxia (n = 3 per group) b, mRNA expression of shown genes in BMDCs isolated from WT mice treated with LPS and ML228, DFX, or after Vhl knockdown (siVhl) (n = 3-for Il1b after LPS, Il12a and Tnf for siVhl, n = 4 otherwise). c, Vhl expression in siVhl-treated BMDCs from b (n = 3 for siNT, n = 4 for siVhl). d, Ifng and Il17a expression in 2D2+ CD4+ T cells co-cultured with WT BMDCs pre-stimulated with LPS and ML228, DFX or siVhl (n = 4 per group). e,f, HIF-1α MFI (e) and frequency of viable cells (f) of BMDCs following LPS stimulation and subjected to normoxia or hypoxia (n = 6 for viability after hypoxia, n = 4 otherwise). g,h, Experimental design (g) and S. thyphimurium CFU quantification (h) in caecum from WT (n = 4) and HIF-1αItgax (n = 5) mice 14 days after infection. i,j, S2W1 Tetramer-specific (i) and IFNγ+ and IL-17+ ( j) CD4+ T cells in colon from mice from h. Statistical analysis was performed using one-way ANOVA with Tukey’s, Dunnett’s or Šídák’s post-hoc test for selected multiple comparisons for a,b,d–f, or unpaired Student’s t-test for c, h-j. Data shown as mean ± s.e.m.

