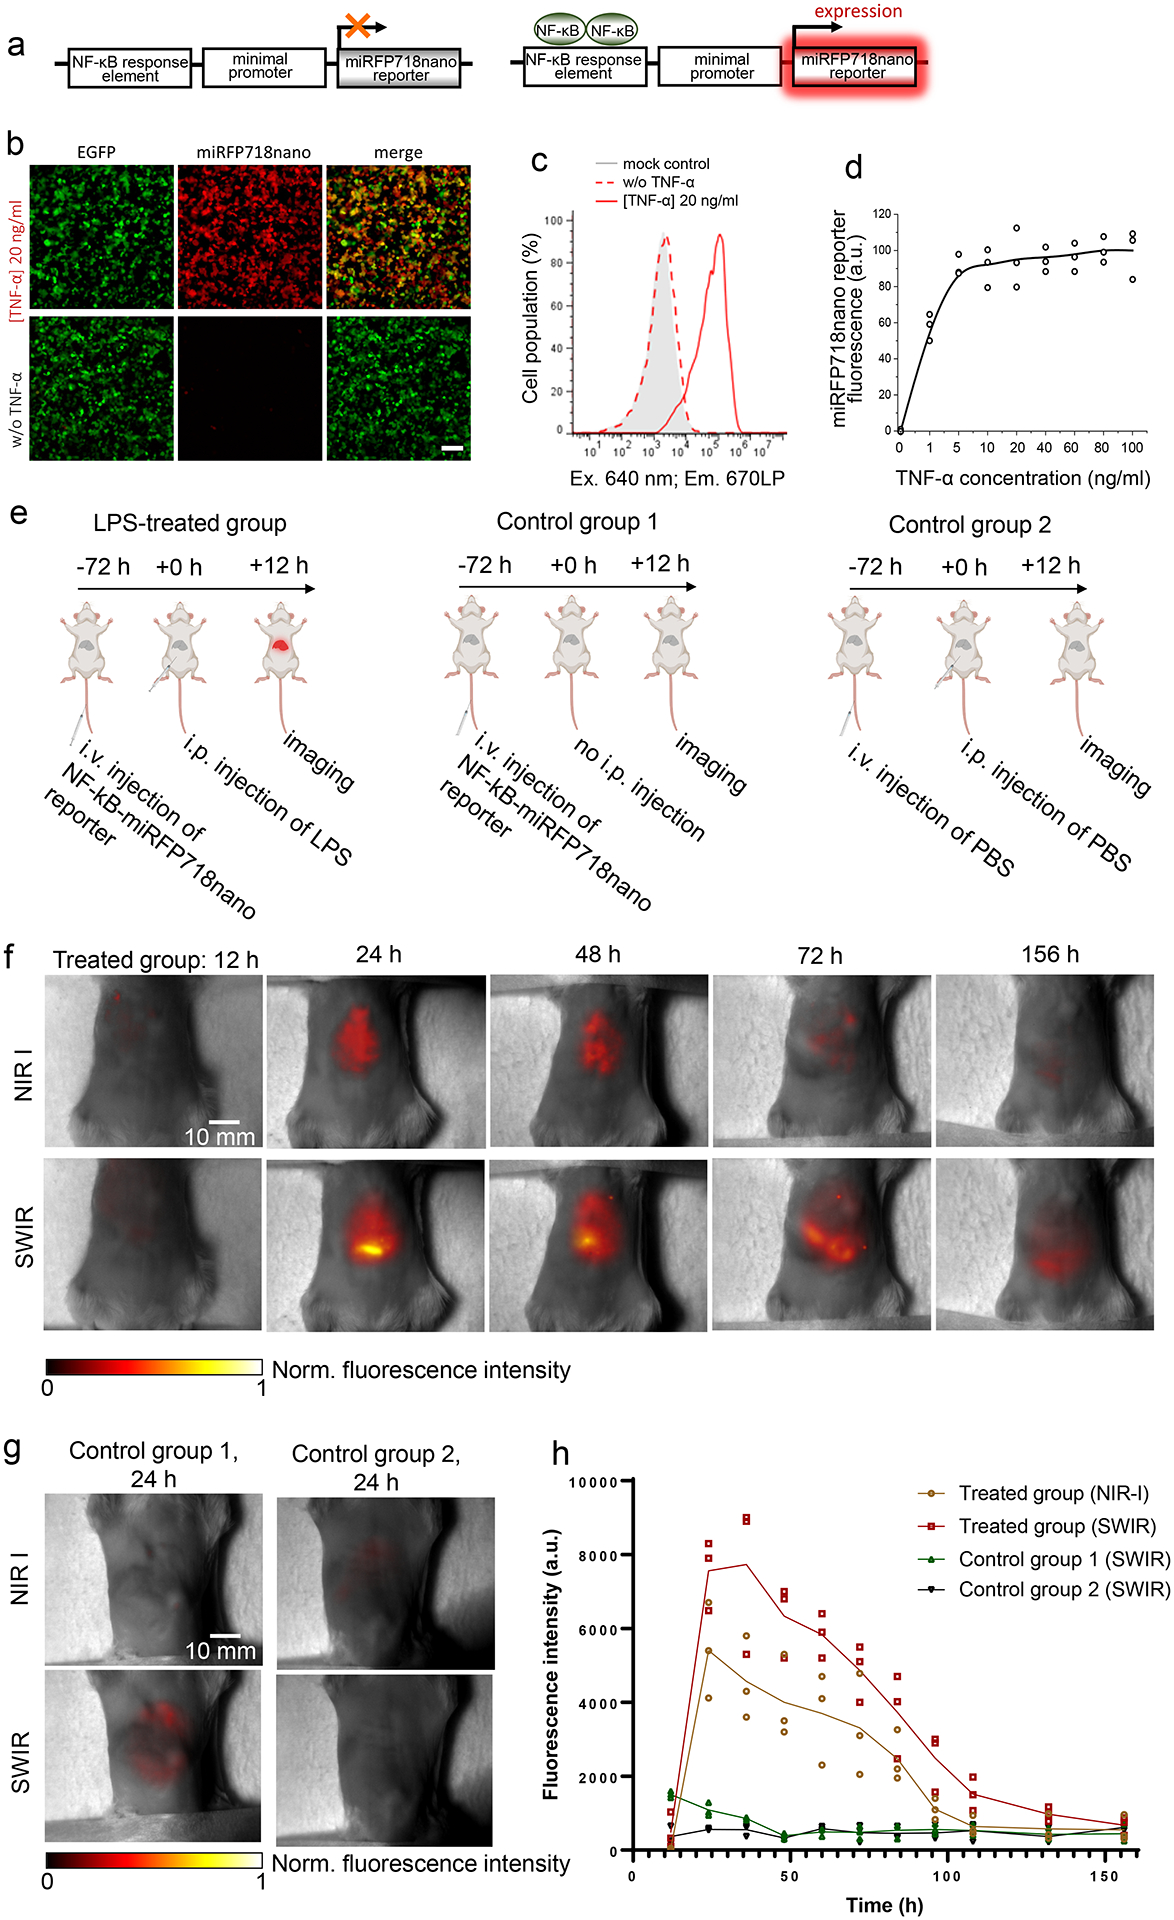
Figure 2. miRFP718nano as a reporter of inflammation.

(a) Schematic representation of miRFP718nano-based reporter of inflammation. (b) HEK293T cells transfected with the miRFP718nano-based reporter of inflammation and cotransfected with pEGFP-N1 (1:10), 20 h after stimulation with TNF-α (20 ng/ml) (top row) or non-treated (bottom row). For imaging of miRFP718nano and EGFP, 685/20 nm excitation and 725/40 nm emission, and 485/20 nm excitation and 525/30 nm emission filters were used, respectively. Representative images of two experiments are shown. Scale bar, 100 μm. (c) TNF-α dose-response in HEK293T cell transfected with miRFP718nano reporter of inflammation, measured by flow cytometry. Data are presented as mean values ± s.d. for n = 3 transfection experiments. Gating was performed as shown in Supplementary Fig. 3. (d) Mean fluorescence intensity of HEK293T cells transiently transfected with miRFP718nano reporter of inflammation 20 h after stimulation with TNF-α (20 ng/ml). (e) The schematics of developing the mouse model injected with miRFP718nano reporter plasmid and LPS, as well as the two control models with only the plasmid or only PBS. (f) Representative NIR-I and SWIR images of the LPS-treated group at different time points after the LPS injection. (g) Representative NIR-I and SWIR images of the two control groups at 24 h. (h) The time course of NIR-I and SWIR signals in the liver region of the three animal groups (n=3 for each group).
