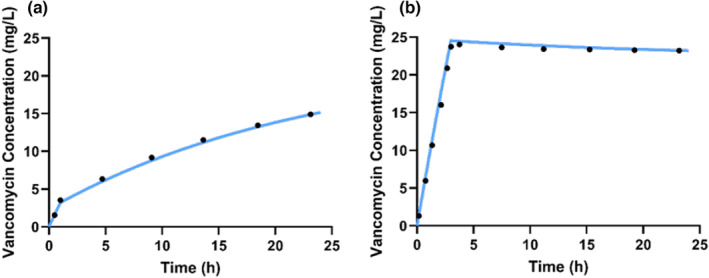
FIGURE 3.

Overlay of simulated concentration‐time curves from Edsim++ and digitized points from the concentration‐time curves for the 5 mg/kg loading dose over 1 h and 40 mg/kg loading dose over 3 h, followed by a 35 mg/kg/day continuous infusion from Roberts et al. 66 to validate accurate input of model into Edsim++.
