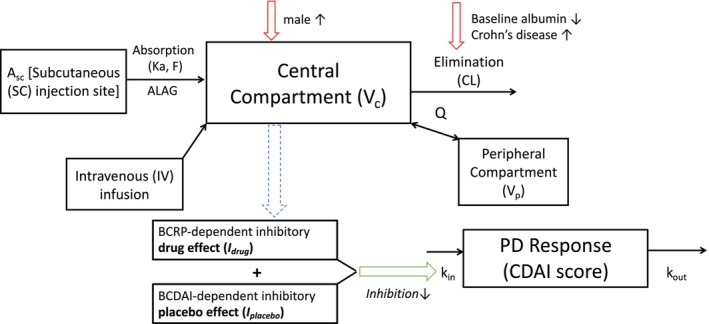
FIGURE 2.

Schematic structure of final PK and biomarker/efficacy models. The PK can be described using a two‐compartment model and is linked to an indirect response model where the total inhibitory effect accounts for the contribution from a placebo effect and drug effect. The drug effect, in turn, depends on the baseline level of the serum IL‐22 or CRP biomarker described by a Hill function . A c and A p are the amount of brazikumab present in the central and peripheral compartments respectively. Similarly, V c and V p are the volumes of distribution of the central and peripheral compartments respectively. A SC represents the amount of brazikumab administered at the subcutaneous injection site and ka and F are the first‐order absorption rate constant and bioavailability respectively. CL is the clearance of brazikumab from the central compartment while Q is the intercompartmental clearance. k in is input function for the CDAI scores while k out is the elimination rate. CL is dependent on BALB and disease status of the subjects and V c is dependent on the gender of the subjects. (a) BIL22‐dependent efficacy model structure. (b) BCRP‐dependent efficacy model structure. CD, Crohn's disease; PK, pharmacokinetic.
