
FIGURE 3.
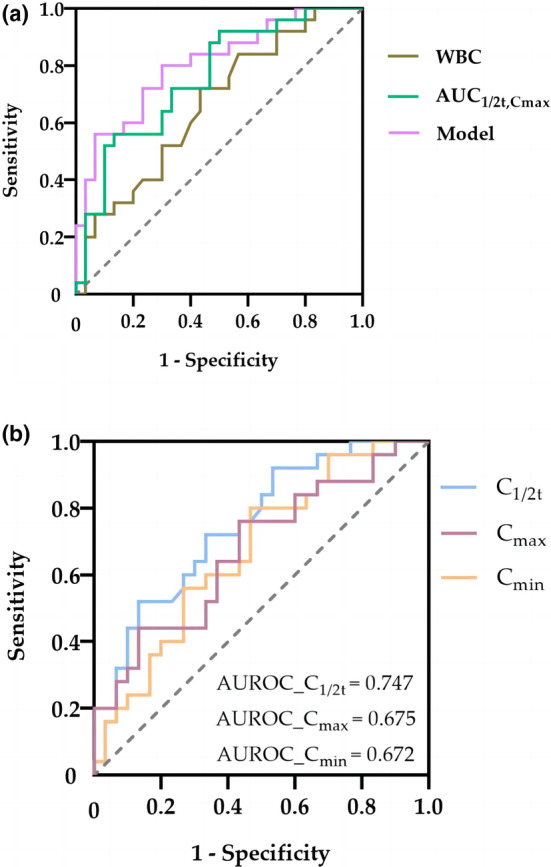
ROC curve of polymyxin B plasma concentrations, the final model, and other factors for predicting AKI. (a) ROC curve of the final model and other factors for predicting AKI. (b) ROC curve of polymyxin B plasma concentrations for predicting AKI. AKI, acute kidney injury; AUC1/2t,max, area under the concentration–time curve estimated using a first‐order pharmacokinetic equation based on C1/2t and Cmax; AUROC, area under the receiver operating characteristic curve; Cmin, trough concentration; C1/2t, mid‐dosing interval concentration; Cmax, peak concentration; ROC, receiver operating characteristic; WBC, white blood cell count.