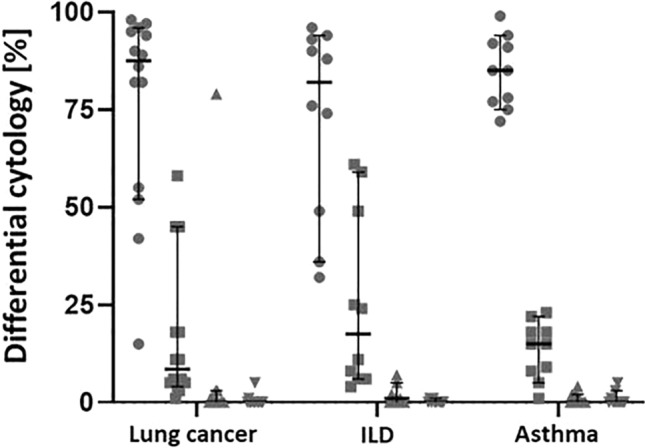
Fig. 2.

Differential cytology in percent of macrophages (●), lymphocytes (■), neutrophils (▲) and eosinophils (▲) obtained from BAL samples of patients with lung cancer (n = 14), ILD (n = 10) and asthma (n = 10). Each data point represents one patient. Data are represented as mean with 95% CI and were tested for statistical differences with two-factor ANOVA with Tukey’s multiple comparison procedure. BAL: bronchoalveolar lavage, ILD: interstitial lung disease
