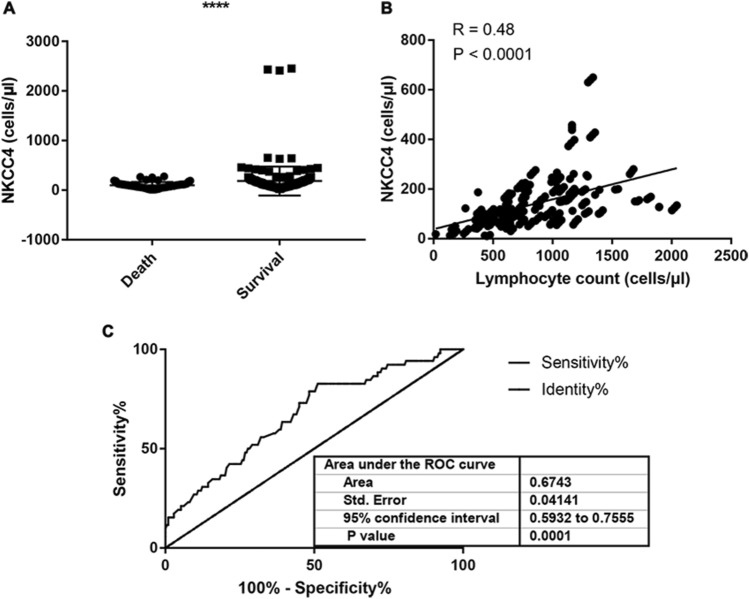
Fig. 1.
Box plot analysis and optimal cutoff value analysis for NKCC4 in this cohort. A Box plot analysis of the NKCC4 in DLBCL patients who were dead or remained survival until the last follow-up. The absolute NKCC4 was significantly higher in survival patients than those who died during the study period (p < 0.0001). B Pearson correlation analysis demonstrated the positive correlation between NKCC4 and total lymphocyte count after four cycles of R-CHOP treatment (exclude data with large discrepancies). C ROC curve analysis identified NKCC4 as a biomarker for death after R-CHOP therapy. Area under the ROC curve analysis suggested a cutoff value of 135 cells/μl (AUC = 0.67)

