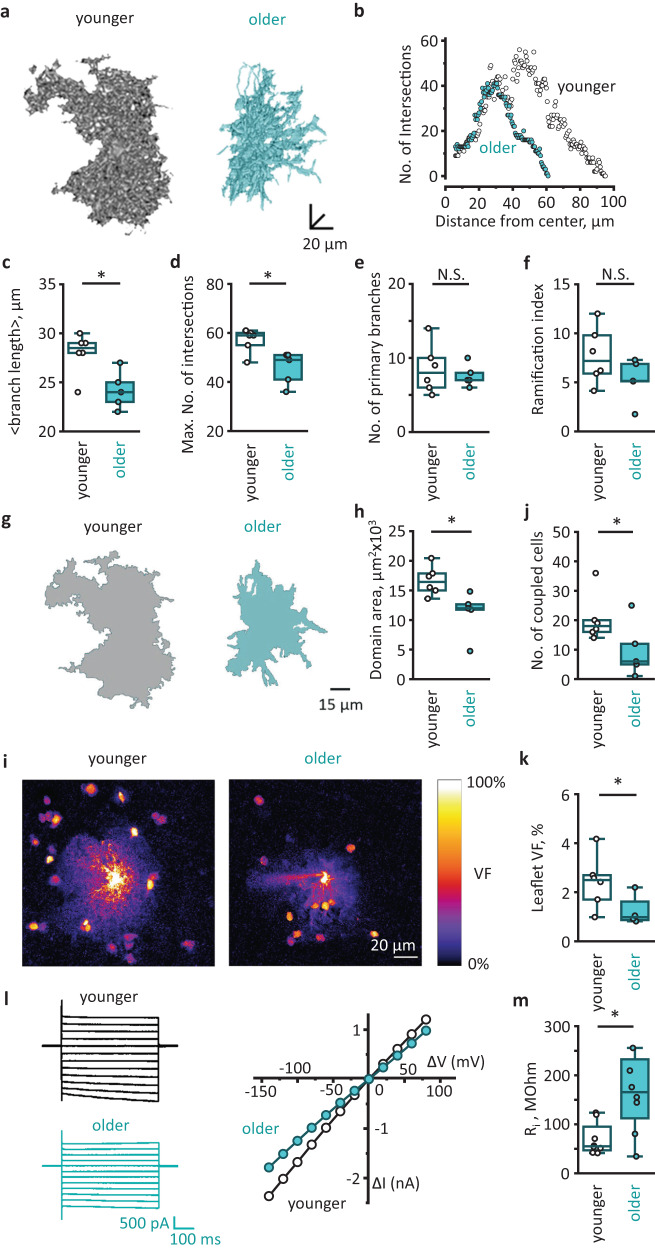
Fig. 2. Age-dependent atrophy of astrocytes.
a Representative three-dimensional (3D) reconstructions of cortical astrocytes loaded with a fluorescent dye (Alexa Fluor 594) through patch pipette in younger (left) and older (right) adults. b 3D Sholl analysis of astrocytes shown in (a). c Mean branch lengths (P = 0.03), d maximum numbers of intersections (P = 0.03), e numbers of primary branches (P = 0.9) and f ramification indexes (P = 0.2) in astrocytes of two age groups (younger adults: N = 6 people; older adults: N = 5 people; cell number n = N). g Astrocytic domain areas obtained as z-projections of 3D reconstructions presented at (a) in younger (gray) and older (blue) adults. h Astrocytic domain areas in two age groups (P = 0.01; N/n—numbers as above). i Astrocytes loaded with Alexa Fluor 594 through patch pipette in younger and older adults. Note fewer neighboring astrocytes loaded through gap junctions in aged astrocytes. The fluorescence intensity was normalized to the fluorescence of soma (100%) to illustrate astrocytic spatial volume fraction (VF) distribution. The scale bar shows color coding for astrocytic VFs from 0 to 100%. j Numbers of coupled astrocytes in two age groups (P = 0.04; younger adults: N = 6; older adults: N = 5 people; cell number n = N). k VFs of astrocytic leaflets in two age groups (P = 0.03; younger adults: N = 6; older adults: N = 4 people; cell number n = N). l Representative currents recorded in response to voltage steps (left; black traces—younger adults, blue traces—older adults) and corresponding current–voltage relationships (right) in astrocytes of two age groups. m Input resistances (Ri) of astrocytes in two age groups (P = 0.04; younger adults: N = 6 people, n = 8 cells; older adults: N = 7 people, n = 7 cells). Data are shown as box-and-whisker plots where the box is Q1 and Q3 with median, whiskers are the ranges within 1.5IQR. Empty boxes/circles—younger adults, filled boxes/circles—older adults. Two-tailed (except for (j), where one-tailed) Mann–Whitney test: N.S.P > 0.05, *P < 0.05. Source data are provided as a Source Data file.

