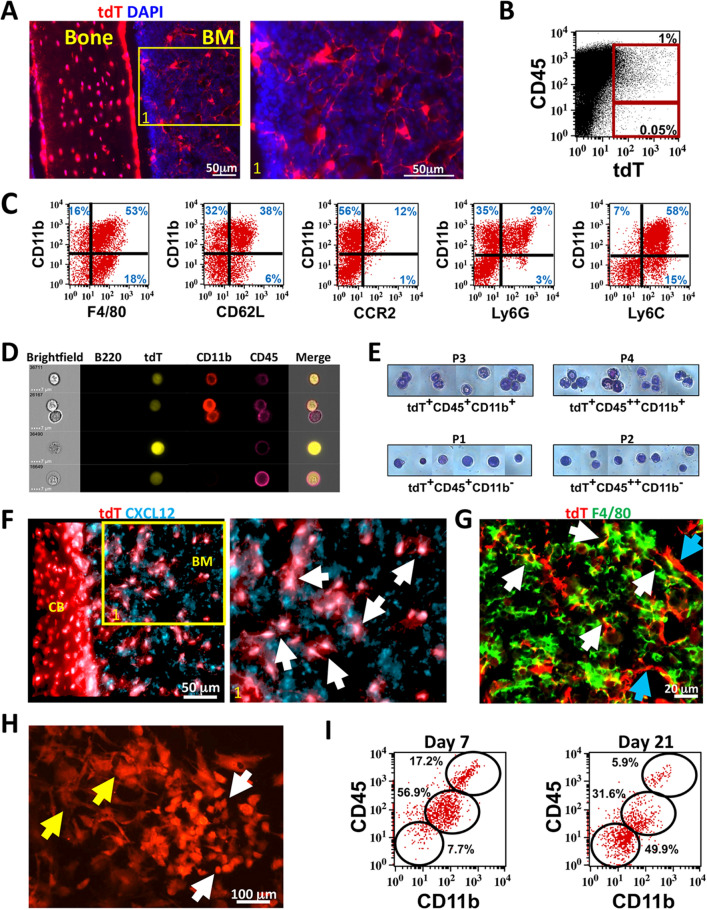
Figure 1.
DMP1-Cre/Ai9 labeled hematopoietic and stromal populations in bone marrow. (A) Femoral frozen histology of 8 week old DMP1-Cre/Ai9 cortical bone and bone marrow (BM). Red-tdT, Blue-DAPI. Yellow box indicates magnified area of BM. (B) Flow cytometric dot plot of bone marrow flush stained for CD45 and tdT. (C) Flow cytometry analysis of CD45+tdT+ population for myeloid markers F4/80, CD62L, CCR2, Ly6G and Ly6C with CD11b. (D) Image stream analysis of tdT+ (yellow) bone marrow cells stained for B220 (green), CD11b (red) and CD45 (magenta). Gating strategy show in Supplemental Fig. 2 to identify single tdT+CD45+ cells. (E) Bone marrow tdT+ cells from 12 week old mice were FACS sorted based on 4 populations identified (P1–P4) for CD45 and CD11b expression and cytospun onto glass slides (gating strategy show in Supplemental Fig. 1). Giemsa staining of each population is shown. (F) 3D rendering of Z stacks from DMP1-Cre/Ai9 cortical bone (CB) and bone marrow (BM) stained for CXCL12 (cyan). Enlarged area shown, white arrows point to colocalization (white) of tdT and CXCL12. (G) Femoral frozen histology of DMP1-Cre/Ai9 bone marrow stained for F4/80 (green). White arrows—F4/80+tdT+ macrophages; Blue arrows—F4/80−tdT+ stromal cells. (H,I) Bone marrow flushes were plated with open B6 femurs to allow for supporting factors in the media. (H) tdT cells were imaged at day 7 of culture. Yellow arrow—stromal cells, White arrow—hematopoietic cells. (I) Flow cytometry analysis of gated tdT+ cells at day 7 and day 21 of culture for CD45 and CD11b expression.

