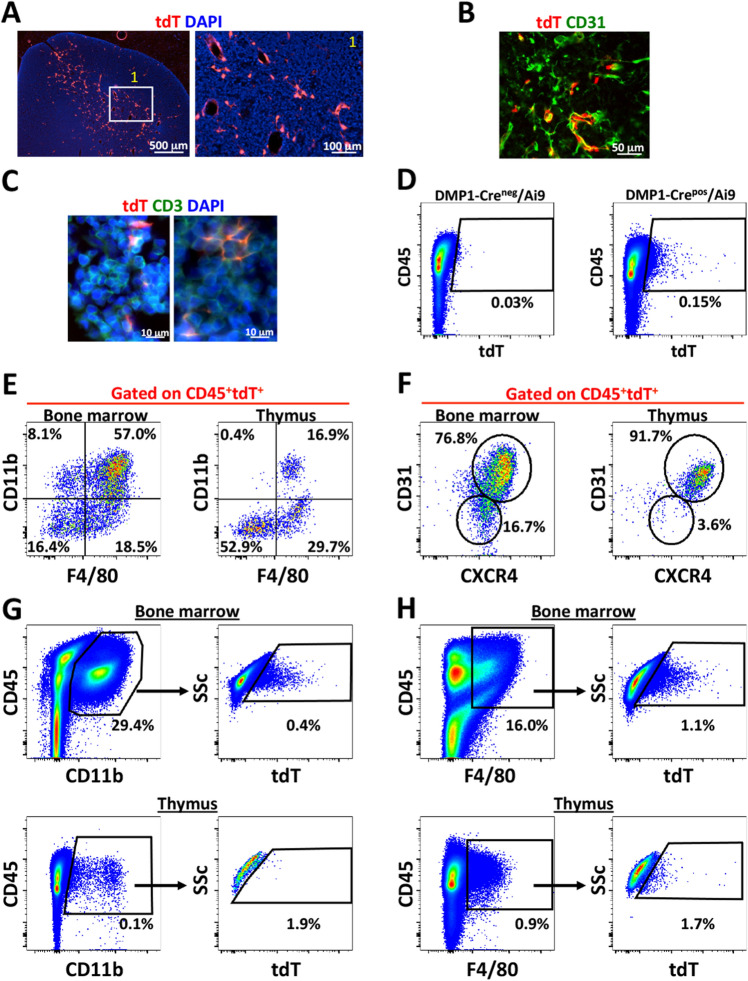
Figure 2.
DMP1-Cre/Ai9 labeled cells in thymus. (A,B) Frozen histology of 8 week old DMP1-Cre/Ai9 thymus for tdT (red), DAPI (blue) and (B) CD31 staining (green). White box indicates magnified area. (C) 10 day old thymus stained for CD3 (green) (D) Flow cytometric of single cell suspensions of thymus from 4 month old Cre− and Cre+ animals. Cell gate shown for CD45+tdT+ cells. (E) FACs plots of CD45+tdT+ bone marrow and thymus cells for CD11b and F4/80 and (F) CD31 and CXCR4 expression. (G) Flow cytometric analysis of tdT+ cells in bone marrow and thymus gated from CD45+CD11b+ cells. (H) Flow cytometric analysis of tdT+ cells in bone marrow and thymus gated from CD45+F4/80+ cells.

