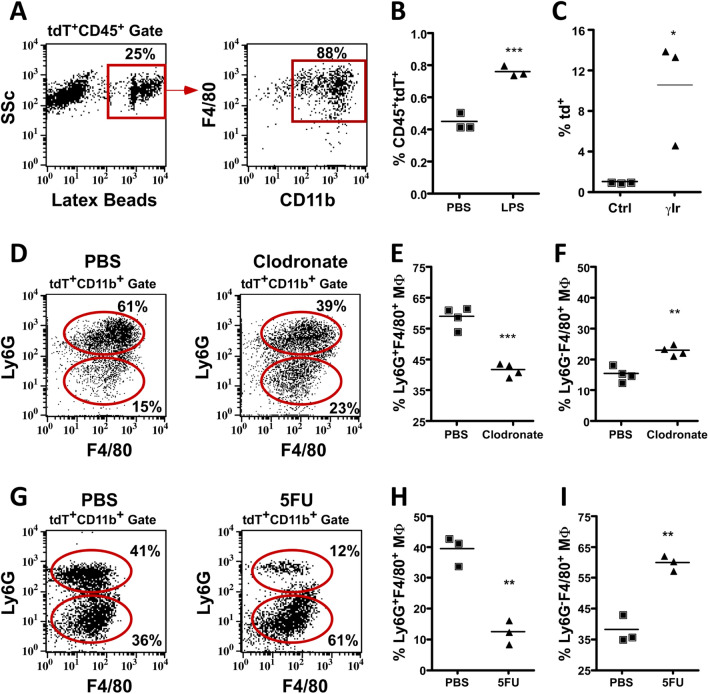
Figure 3.
Macrophage properties of DMP1-Cre/Ai9 labeled hematopoietic fraction in bone marrow. (A) Bone marrow flush incubated with 1 mM latex YG beads and then stained for CD11b and F4/80. FACs plots are first gated on CD45+tdT+ population, then fluorescent latex beads. (B) Flow analysis of 12 week old mice quantified for the CD45+tdT+ population in mice treated for 3 h with 25 mg LPS, ***p = 0.0009. (C) Percent tdT+ cells in 3 month old control (Ctrl) and 6 days post lethal gamma irradiation (γIr) dose (950 rads) *p = 0.0327 (D–F) 8 week old DMP1-Cre/Ai9 animals 36 h after macrophage depletion with clodronate loaded liposomes compared to control. Representative flow cytometry analysis of the macrophage (MΦ) tdT+CD11b+ population for F4/80 and Ly6G which is quantified in (E) for percent Ly6G−F4/80+ MΦ cells, **p = 0.002 and (F) percent Ly6G+F4/80+ MΦ cells, ***p = 0.0001. (G–I) 8 week old DMP1-Cre/Ai9 animals 4 days after single dose of 5-FU. Representative flow cytometry analysis of macrophages within the tdT+CD11b+ population for F4/80 and Ly6G which is quantified in (H) for percent Ly6G−F4/80+ MΦ cells, **p = 0.0018, and (I) percent Ly6G+F4/80+ MΦ cells, **p = 0.0016. n = 3–4 and SEM is shown in all graphs.

