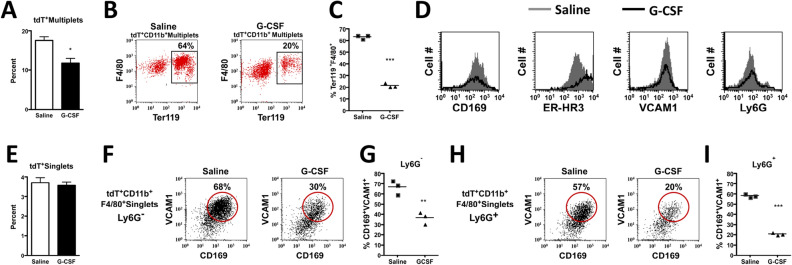
Figure 5.
Effect of G-CSF on the DMP1-Cre/Ai9 labeled erythroid blood islands and EIMs. G-SCF was administered to 5 week old DMP1-Cre/Ai9 animals at 50 mg/kg, twice a day for 3 days. BM was processed for intact blood islands, n = 3. (A) Quantified flow data of percent tdT+Multiplets in PBS and G-CSF treated mice, *p = 0.0218. (B) Representative FACs plots of tdT+CD11b+Multiplets with cells double positive for F4/80 and Ter119 which is quantified in (C) ***p = < 0.0001. (D) Histograms of G-CSF (black line) and PBS (grey filled line) treated mice for expression of EIM markers within the tdT+CD11b+Ter119+F4/80+Multiplet gates. (E–I) BM flushes with niche disruption and RBC lysis after G-CSF treatment. (E) Quantified flow data of percent tdT+Singlets in PBS and G-CSF treated mice. (F) Representative FACs plots of tdT+CD11b+F4/80+Ly6G−Singlets with cells double positive for CD169 and VCAM1 which is quantified in (G) **p = 0.0043. (H) Representative FACs plots of tdT+CD11b+F4/80+Ly6+Singlets which is quantified in (I) ***p < 0.0001. SEM is shown in all graphs.

