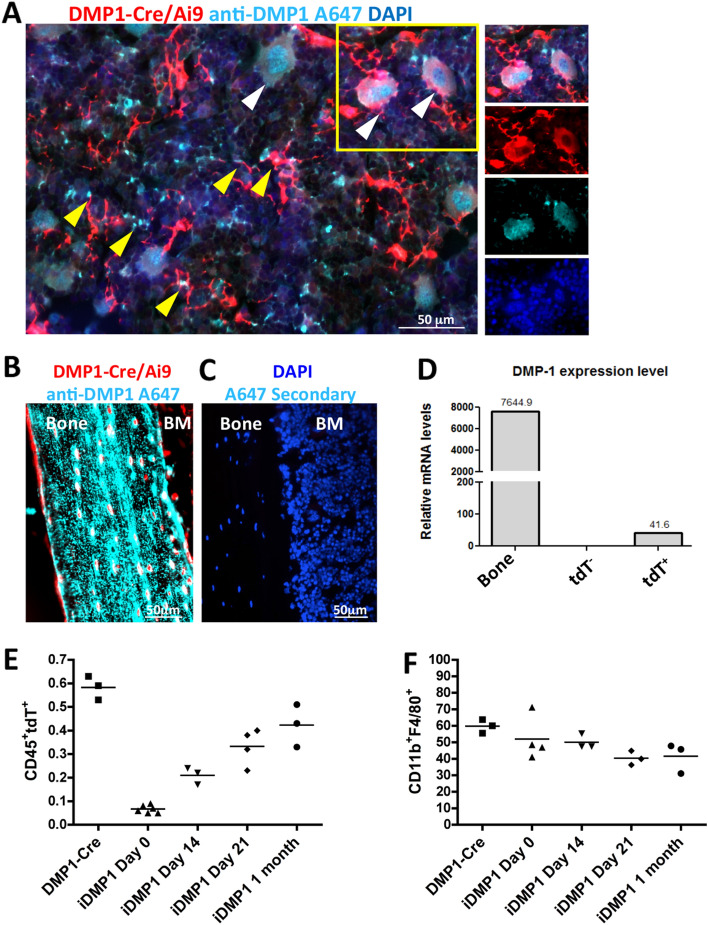
Figure 6.
Endogenous DMP1 expression and lineage tracing of DMP1 in bone marrow. (A,B) Femoral frozen sections from DMP-Cre/Ai9 (red) stained with anti-DMP1 antibody (cyan) in bone marrow (A) and cortical bone as positive control (B). White arrows indicate colocalization of DMP1-Cre labeled macrophages with DMP1 protein. Yellow arrows indicate DMP1-Cre labeled stromal cells with colocalization of DMP1 protein or within close proximity to secreted DMP1 protein. (C) Secondary only staining in a Cre− littermate as negative control. Blue-DAPI (D) Relative mRNA expression of DMP-1 from sorted tdT− and tdT+ bone marrow cells. RNA from bone was used as positive control. Representative experiment shown, n = 2. (E) Quantification of CD45+tdT+ cells by flow cytometry in lineage traced 6 week old Tamoxifen injected iDMP1-Cre/Ai9 animals, n = 3–5. (F) Quantification of percent CD11b+F4/80+ that are CD45+tdT+ cells in lineage traced iDMP1-Cre/Ai9 animals, n = 3–4. SEM is shown in graphs.

