Figure 1.
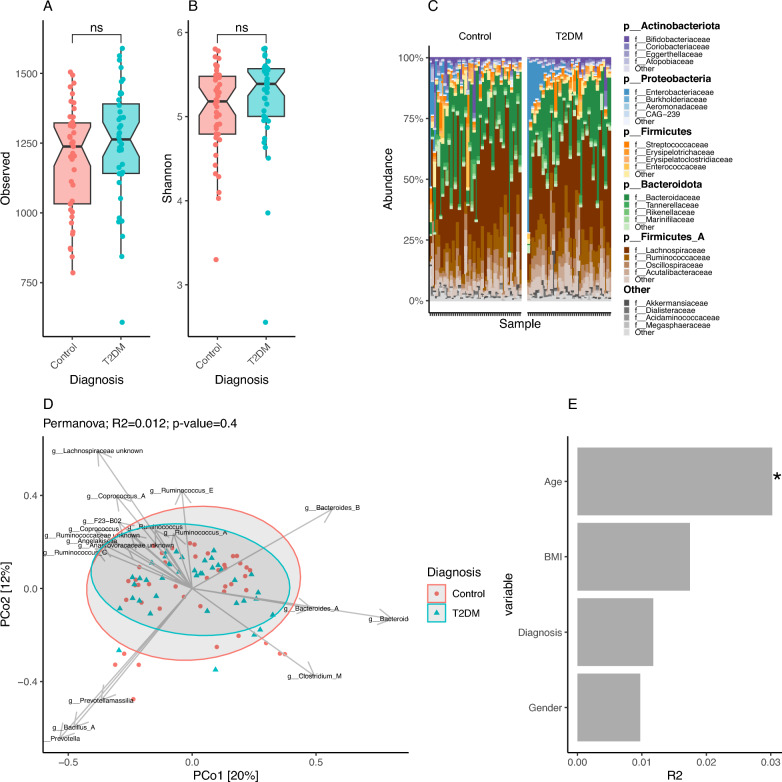
Microbial diversity, taxonomic and compositional profiling of the study cohort. Differences in species richness (A) and evenness (B, Shannon index) between Control (n = 43- and T2DM (n = 40) individuals (ns = p-value < 0.05; Wilcoxon rank-sum test). (C) Taxonomic profile of the study cohort based on phylum-level annotations derived from UHGC1.0 database. For the 4 most abundance phylums, the top 4 family features are visualized. Others bin groups phylum with relative abundances < 2%. Samples are ordered by the relative abudance of Enterobacteriaceae family. (D) PCoA ordination based on Bray–Curtis beta-diversity matrix computed from genus-level abundance data. Samples are colored based on the clinical study group. Abundance vectors of 18 bacterial genera with the most significant associations with the k = 3 enterotypes (FDR < 0.05; Kruskal–Wallis test; Supplemental Fig. 2) are fitted on the ordination plot with envfit function of the vegan R package. (E) Impact of different covariates over microbiome composition of the study cohort. Barplot represents the effect sizes (R2, x-axis) product of Permanova tests assessing the marginal effects of each covariate in the x-axis over Bray–Curtis beta-diversity matrix computed from genus-level abundance data (each covariate analyzed in a model with all other covariates plus the resequencing status of the sample; adonis2 function of vegan package; *p-value < 0.05).

