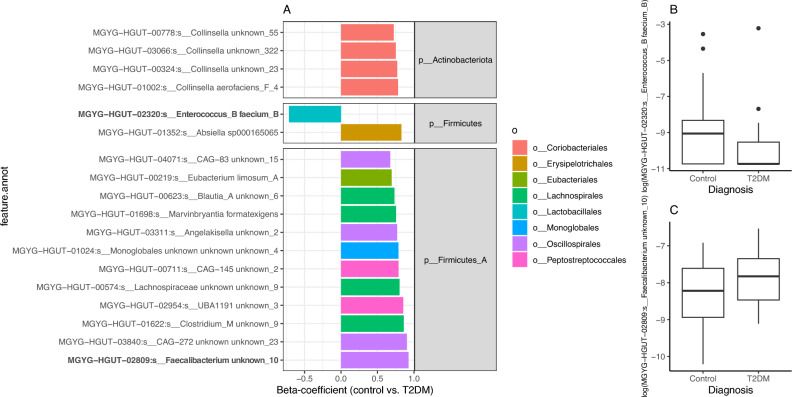
Figure 2.
Species features with significant differences in abundance between T2DM and Control groups in the study cohort. (A) Barplot of beta coefficients in the abundance of 18 bacterial species with strongest significant differences in abundances between the Control and T2DM group (p-value < 0.01; linear regression model with log-transformed species abundances by disease state adjusted by age and resequencing status of the samples; full results in Supplemental Table 2). (B,C) Boxplots of log-transformed abundances of 2 bacterial species in bold y-axis of barplot of panel A illustrating the direction of abundance changes between study groups.

