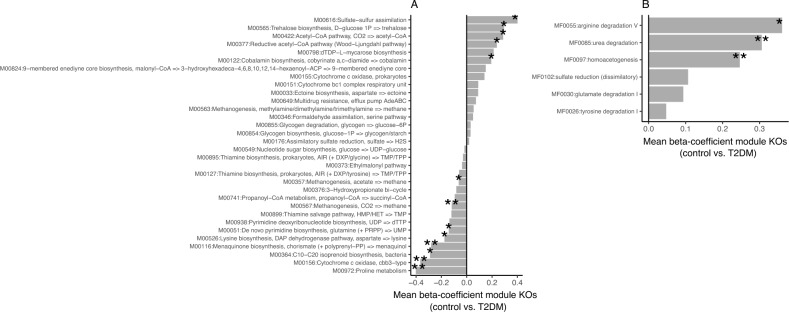
Figure 3.
Functional features with significant differences between Control and T2DM groups in the study cohort. (A) 32 KEGG modules significantly enriched in differentially abundant KO groups between Control and T2DM groups (** FDR < 0.05, *P value < 0.05; Gene Set Enrichment Analyses). The mean beta coefficients of module KOs abundances between control and T2DM individuals are represented as an indicator of enrichment direction (linear regression of log-transformed KO abundances by disease state adjusted by age and resequencing status; modules enriched in the T2DM group = mean beta coefficients of KO groups in Controls vs. T2DM > 0; modules enriched in the Control group = mean beta coefficients of KO groups in Controls vs. T2DM < 0). (B) Same as (A) for 6 Gut Metabolic Modules (GMMs) significantly enriched in differentially abundant KO groups between Control and T2DM groups (**FDR < 0.05; Gene Set Enrichment Analyses).

