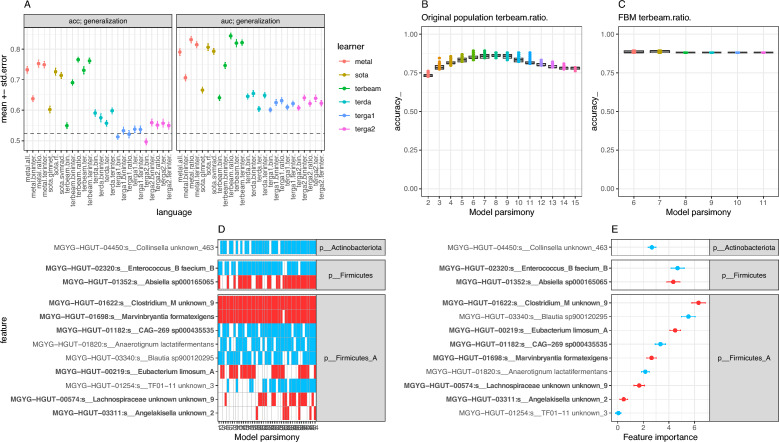
Figure 4.
Prediction of T2DM state from taxonomic abundances based on Predomics models. (A) mean ± standard error of accuracy (acc) and AUC of T2DM predictions of best models based on 26 different learners integrated into the Predomics package from 10 times tenfold cross-validation schema. The dashed line represents the majority class (i.e., the accuracy obtained when simply predicting the T2DM status through chance alone; 0.52). Predictions from terbeam learner and ratio language show the best performance in comparison with other BTR models. (B) Boxplots of the accuracy (y-axis) of terbeam-ratio models (n = 1316) at different model sparsities (number of features per model; x-axis). (C) Same as the B panel for the Family of Best Models (FBM; n = 44 terbeam-ratio models whose accuracy is within a given window of the best model’s accuracy). (D) Heatmap representing the prevalence of the 12 bacterial species (y-axis) included in the 44 models in the FBM (red = presence; white = absence). (E) Mean ± standard error of feature importance variable (decrease accuracy when the feature is removed in cross-validation process) for the 12 bacterial species included in the terbeam-ratio FBM (red = high mean abundance in the T2DM group; blue = High mean abundance in the control group). Species overlapping with the ones showing significant changes in differential abundance analyses (p-value < 0.05; linear regression model with log-transformed species abundances by disease state adjusted by age and resequencing status of the samples; Fig. 3 and Supplemental Table 2) are highlighted in bold.

