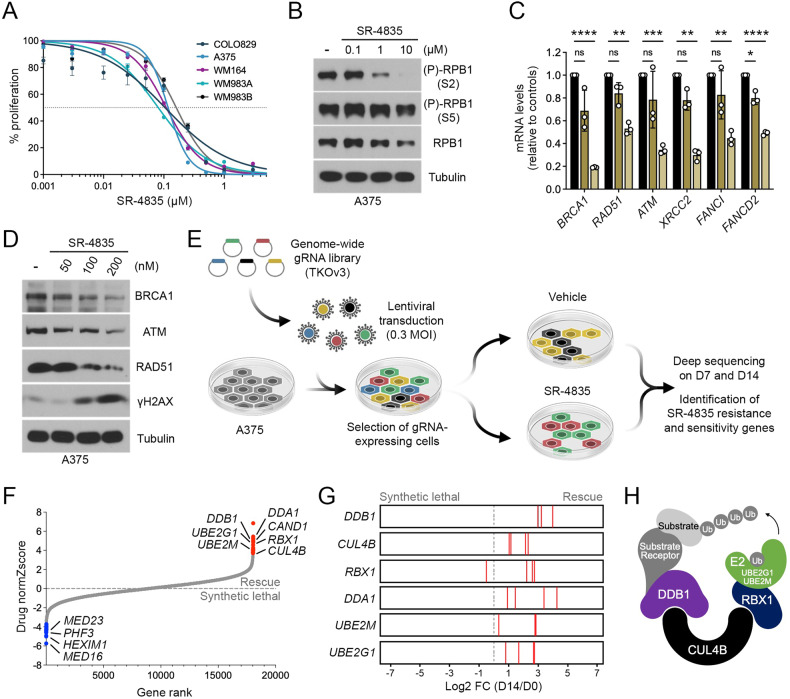
Fig. 1. Characterization of SR-4835 in BRAF-mutated melanoma cells.
A Proliferation assay was performed using a panel of BRAF-mutated melanoma cell lines treated with increasing doses of SR-4835 for 96 h. Respectively, the IC50 for A375, 117.5 nM; Colo829, 104.5 nM; WM164, 109.6 nM; WM983A, 80.7 nM; WM983B 160.5 nM. B Immunoblot depicting RPB1 phosphorylation levels in A375 cells treated with SR-4835 (0.1, 1 and 10 µM) for 6 h. C qPCR analysis from A375 cells treated for 6 h with SR-4835 (30 and 100 nM). D Immunoblot of A375 cells treated for 24 h with SR-4835 (0.05, 0.1 and 0.2 µM). E Schematic representation of the CRISPR/Cas9 screen used to characterize SR-4835 activity. F Waterfall depicting differential gene essentiality in A375 treated with SR-4835 based on comparison of gRNA abundance before and after 14 days of treatment. G Bar graphs illustrating the Log2 fold-change of the four gRNAs targeting DDA1, DDB1, UBE2M, UBE2G1, CUL4B, RBX1 genes at day 14 in A375 treated with SR-4835. H Schematic representation of the CRL4B complex (RBX1-CUL4B-DDB1). (A, C) Data are represented as mean ± SD of independent experiment, n = 3. Representative data of n = 3 (B, D) or normZscore of independent sgRNA, n = 4 (F). Significance was determined using unpaired two-tailed Student’s t-tests (C). P values signification: ns not significant; *P < 0.05; **P < 0.01; ***P < 0.01; ****P < 0.001.

