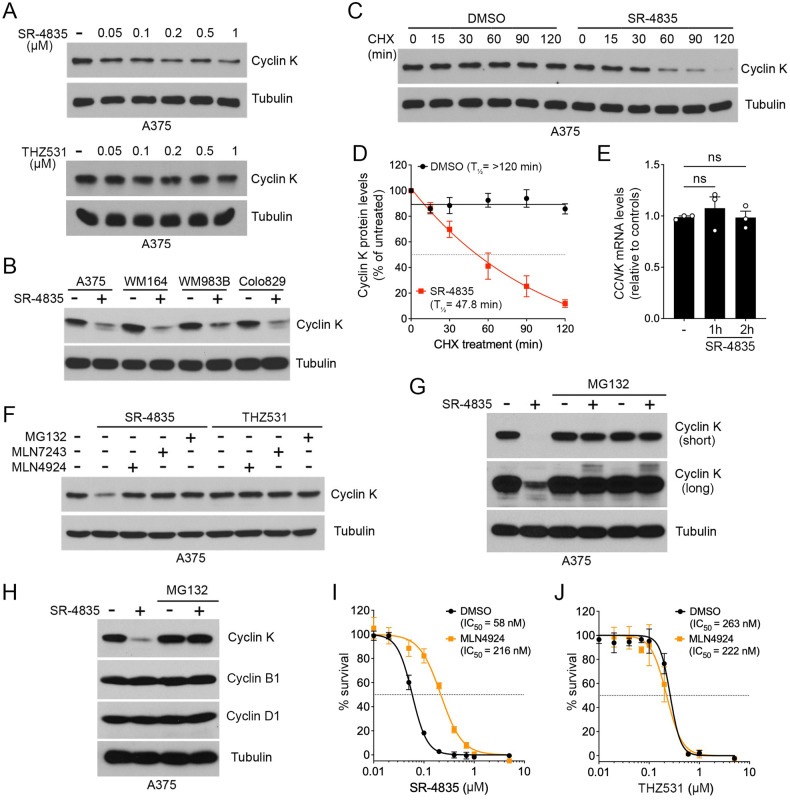
Fig. 2. SR-4835 promotes the proteasomal degradation of cyclin K.
A Immunoblot depicting cyclin K levels in A375 cells treated with SR-4835 or THZ531 (0.05, 0.1, 0.2, 0.5 and 1 µM) for 2 h. B Immunoblot depicting cyclin K levels in melanoma cell lines treated with SR-4835 (1 µM) for 2 h. C A375 cells were treated with vehicle (DMSO) or SR-4835 (1 µM) during a time course of cycloheximide (CHX) treatment (100 µg/mL). Endogenous cyclin K levels were analyzed by immunoblotting. D Densitometric analysis of cyclin K levels was performed on CHX time course shown in C. The data were normalized to tubulin and then expressed relative to respective controls (t = 0). E qPCR of A375 cells treated with SR-4835 (1 µM) for indicated times. F A375 cells were treated with MG132 (10 µM), MLN7243 (1 µM) or MLN4924 (0.5 µM) for 1 h before 2 h of SR-4835 or THZ531 treatment (1 µM). G Immunoblot depicting cyclin K levels in A375 cells treated with SR-4835 (1 µM) for 6 h following a 2 h pre-treatment with MG132 (10 µM). H Same as G, except that immunoblots depict levels of cyclins B1, D1 and K. I Proliferation assay was performed in A375 cells treated with SR-4835 at indicated doses combined with MLN4924 (0.5 µM) for 72 h. Respectively, IC50 value for SR-4835 alone is 58 nM, and 216 nM when in combination with MLN4924. J Same as I, except that A375 cells were treated with THZ531. IC50 concentration for A375 with THZ531 alone is 263 nM, and 222 nM when combined with MLN4924. (A, B, F - H) Representative data of n = 3 or n = 4 (C). Data are represented as mean ± SD of independent experiments, n = 4 (D), n = 3 (E) or independent replicate, n = 4 (I, J). Significance was determined using unpaired two-tailed Student’s t-tests (E). P-values signification: ns not significant.

