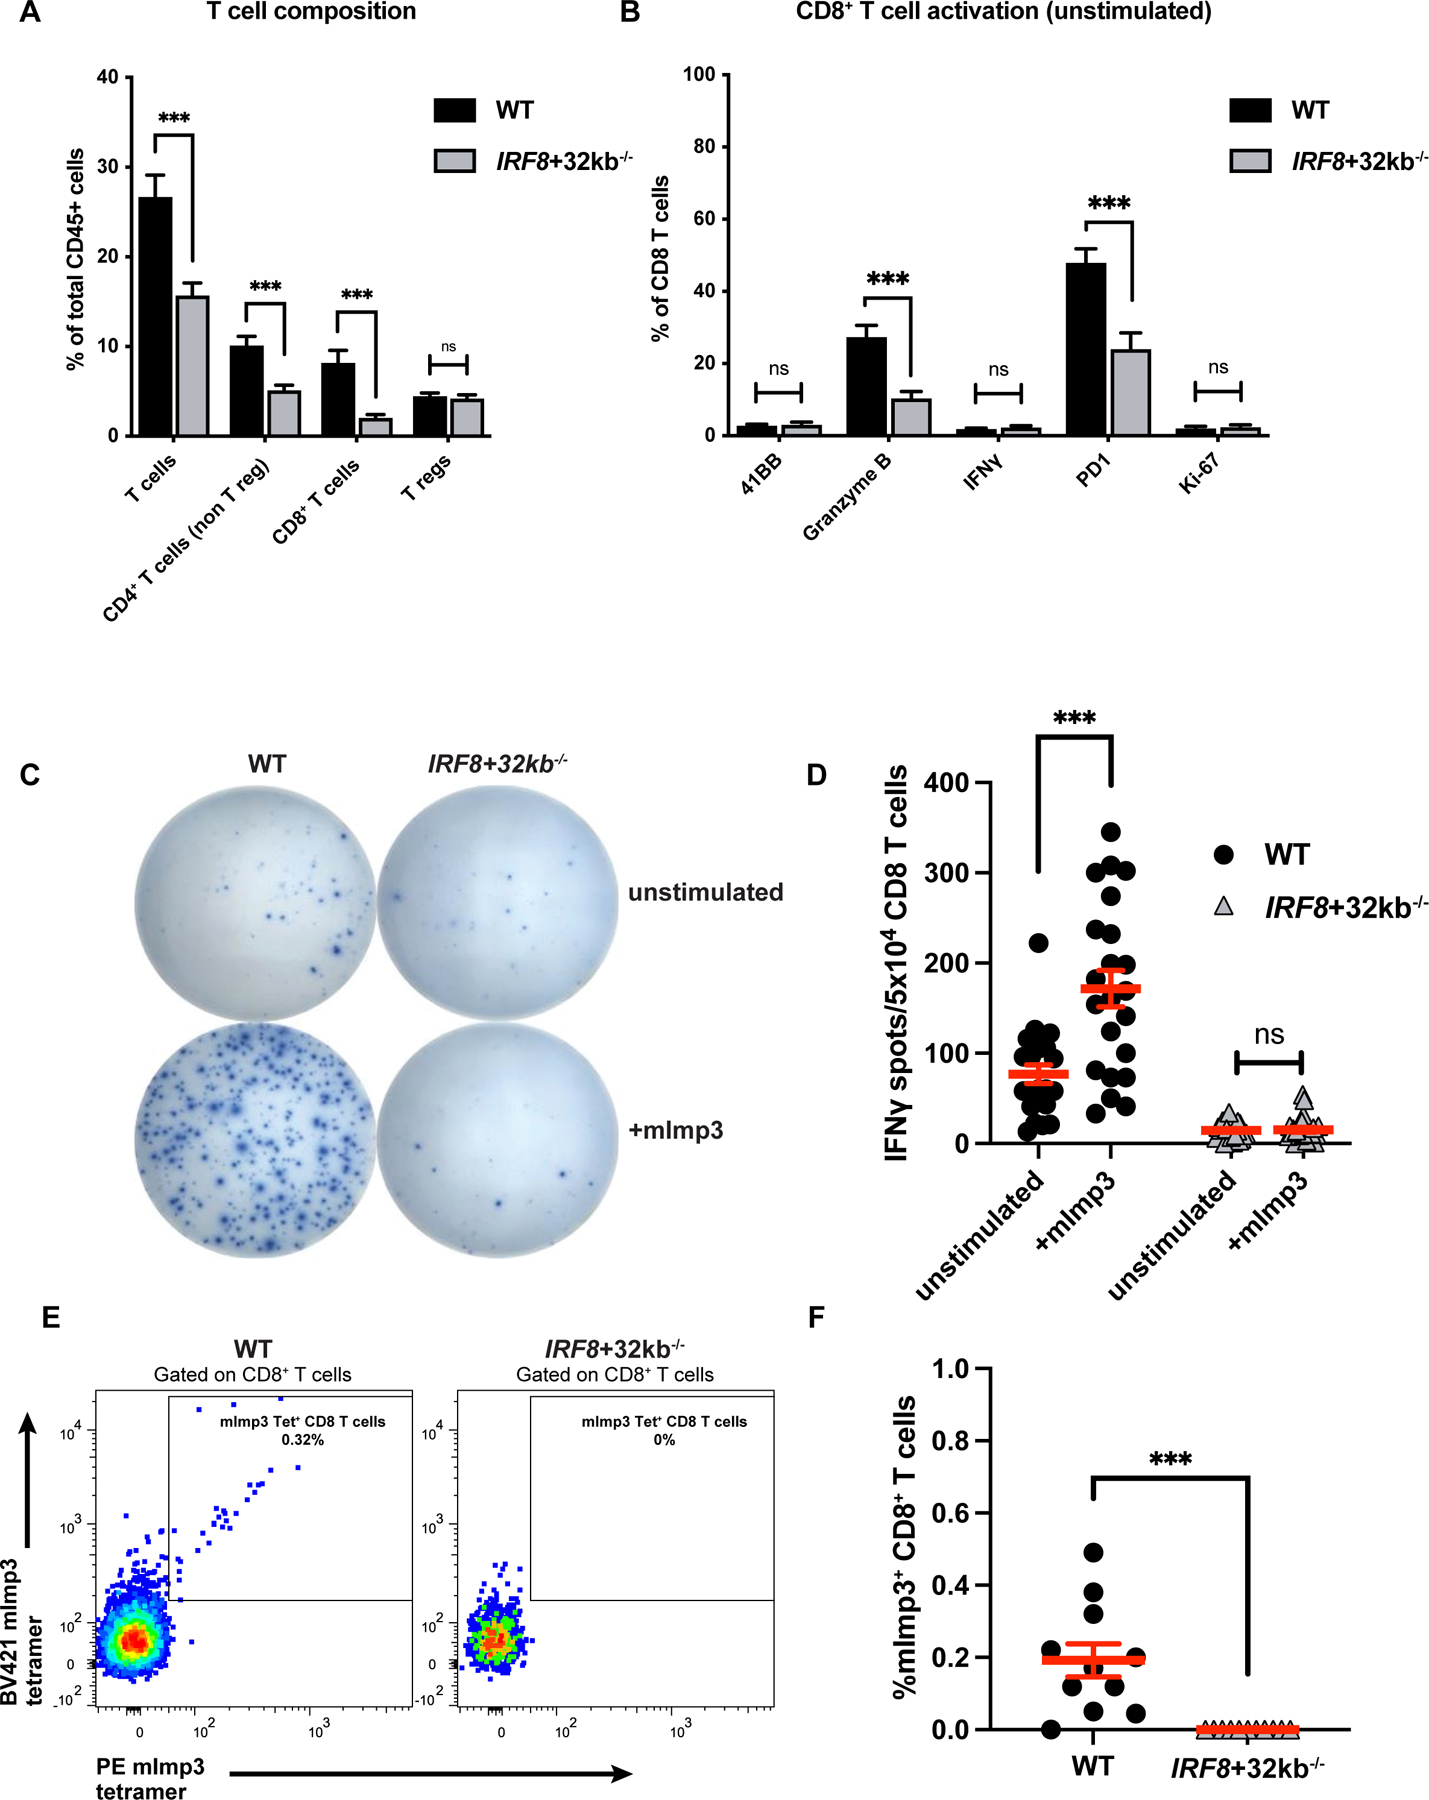
Figure 2. cDC1 prime effector and neoantigen-specific CD8 T-cell responses against mouse GBM.

(A) T-cell composition of wild-type (WT) vs. IRF8+32kb−/− GL261 brain tumors assessed by flow cytometry. (B) CD8+ T-cell activation marker expression of WT (16 mice) vs. IRF8+32kb−/− (15 mice) GL261 brain tumors assessed by flow cytometry. (C-D) CD8+ T-cells were purified from tumors of WT (11 mice) and IRF8+32kb−/− (12 mice) mice bearing GL261 tumors and assessed by ELISPOT (IFNγ release) for mImp3 neoantigen-specific CD8+ T-cell responses. (C) Representative images and (D) quantification. (E-F) mImp3 neoantigen specific CD8+ T-cell responses assessed by tetramer staining and flow cytometry (11 WT and 11 IRF8+32kb−/− mice). (E) Representative histograms and (F) cumulative results. Data are represented as mean +/- SEM of at least three independent experiments. ***p <0.001, ns: not significant. Differences in cell infiltrate, tetramer binding, and IFNγ release analyzed with unpaired two-tailed T tests.
