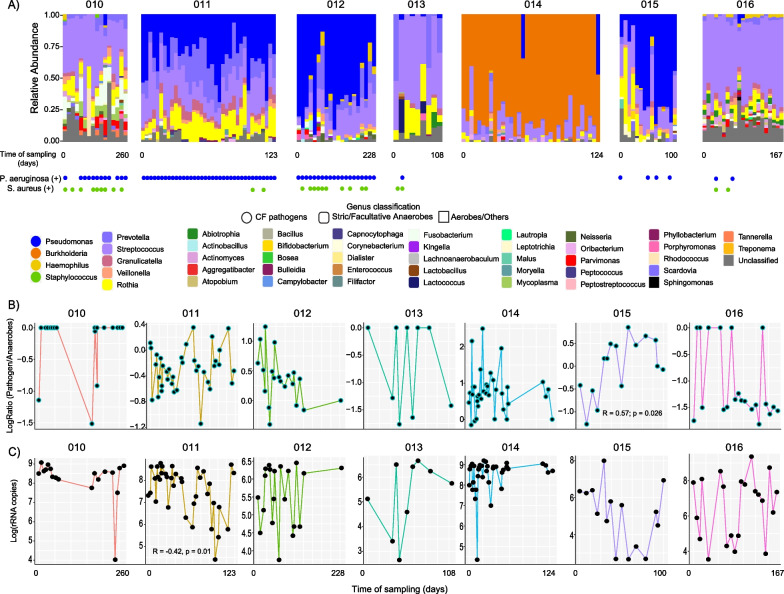
Fig. 3.
Microbiome dynamics of subjects on ETI therapy through time of sampling. A Bar plots representing the microbiome’s relative abundance of longitudinally collected sputum samples from seven subjects on ETI. The sample collection time point (beginning and end of days) per subject is displayed, while gaps across sampling are not shown. The results of bacterial cultures in the clinics are shown for P. aeruginosa and S. aureus. The genus level and its classification as a CF classic pathogen as well as their oxygen tolerance are also presented. B Line-dot plots represent the pathogen:anaerobe log-ratios and C log rRNA gene copies in the sputum of each subject on ETI treatment collected through time.

