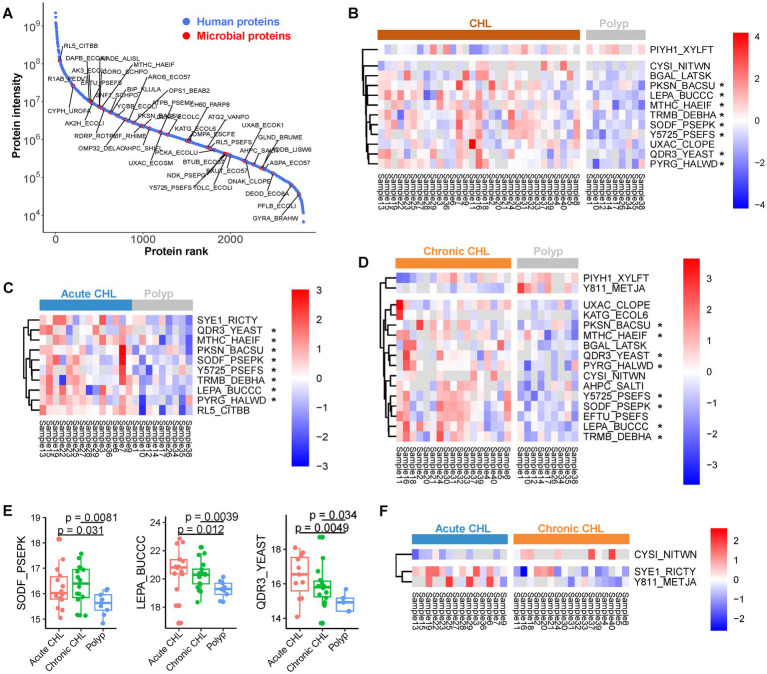
Figure 4.
The microbial proteins identified from gallstone and polyp bile samples. (A) Abundance rank of identified proteins. The intensity of each protein was determined by summing up the LFQ values across all samples. Microbial proteins were highlighted. (B) The abundance of differential microbial proteins between CHL (n = 31) and polyp (n = 9) patients. (C) The differential microbial proteins between acute CHL (n = 14) and polyp (n = 9) patients. (D) The differential microbial proteins between chronic CHL (n = 17) and polyp (n = 9) patients. (E) Three microbial proteins upregulated in CHL compared to polyp. p values were calculated using Welch’s t test. (F) The differential microbial proteins between acute CHL (n = 14) and chronic CHL (n = 17) patients.

