
Extended Data Fig. 5. TSPY gene similarity and architecture.
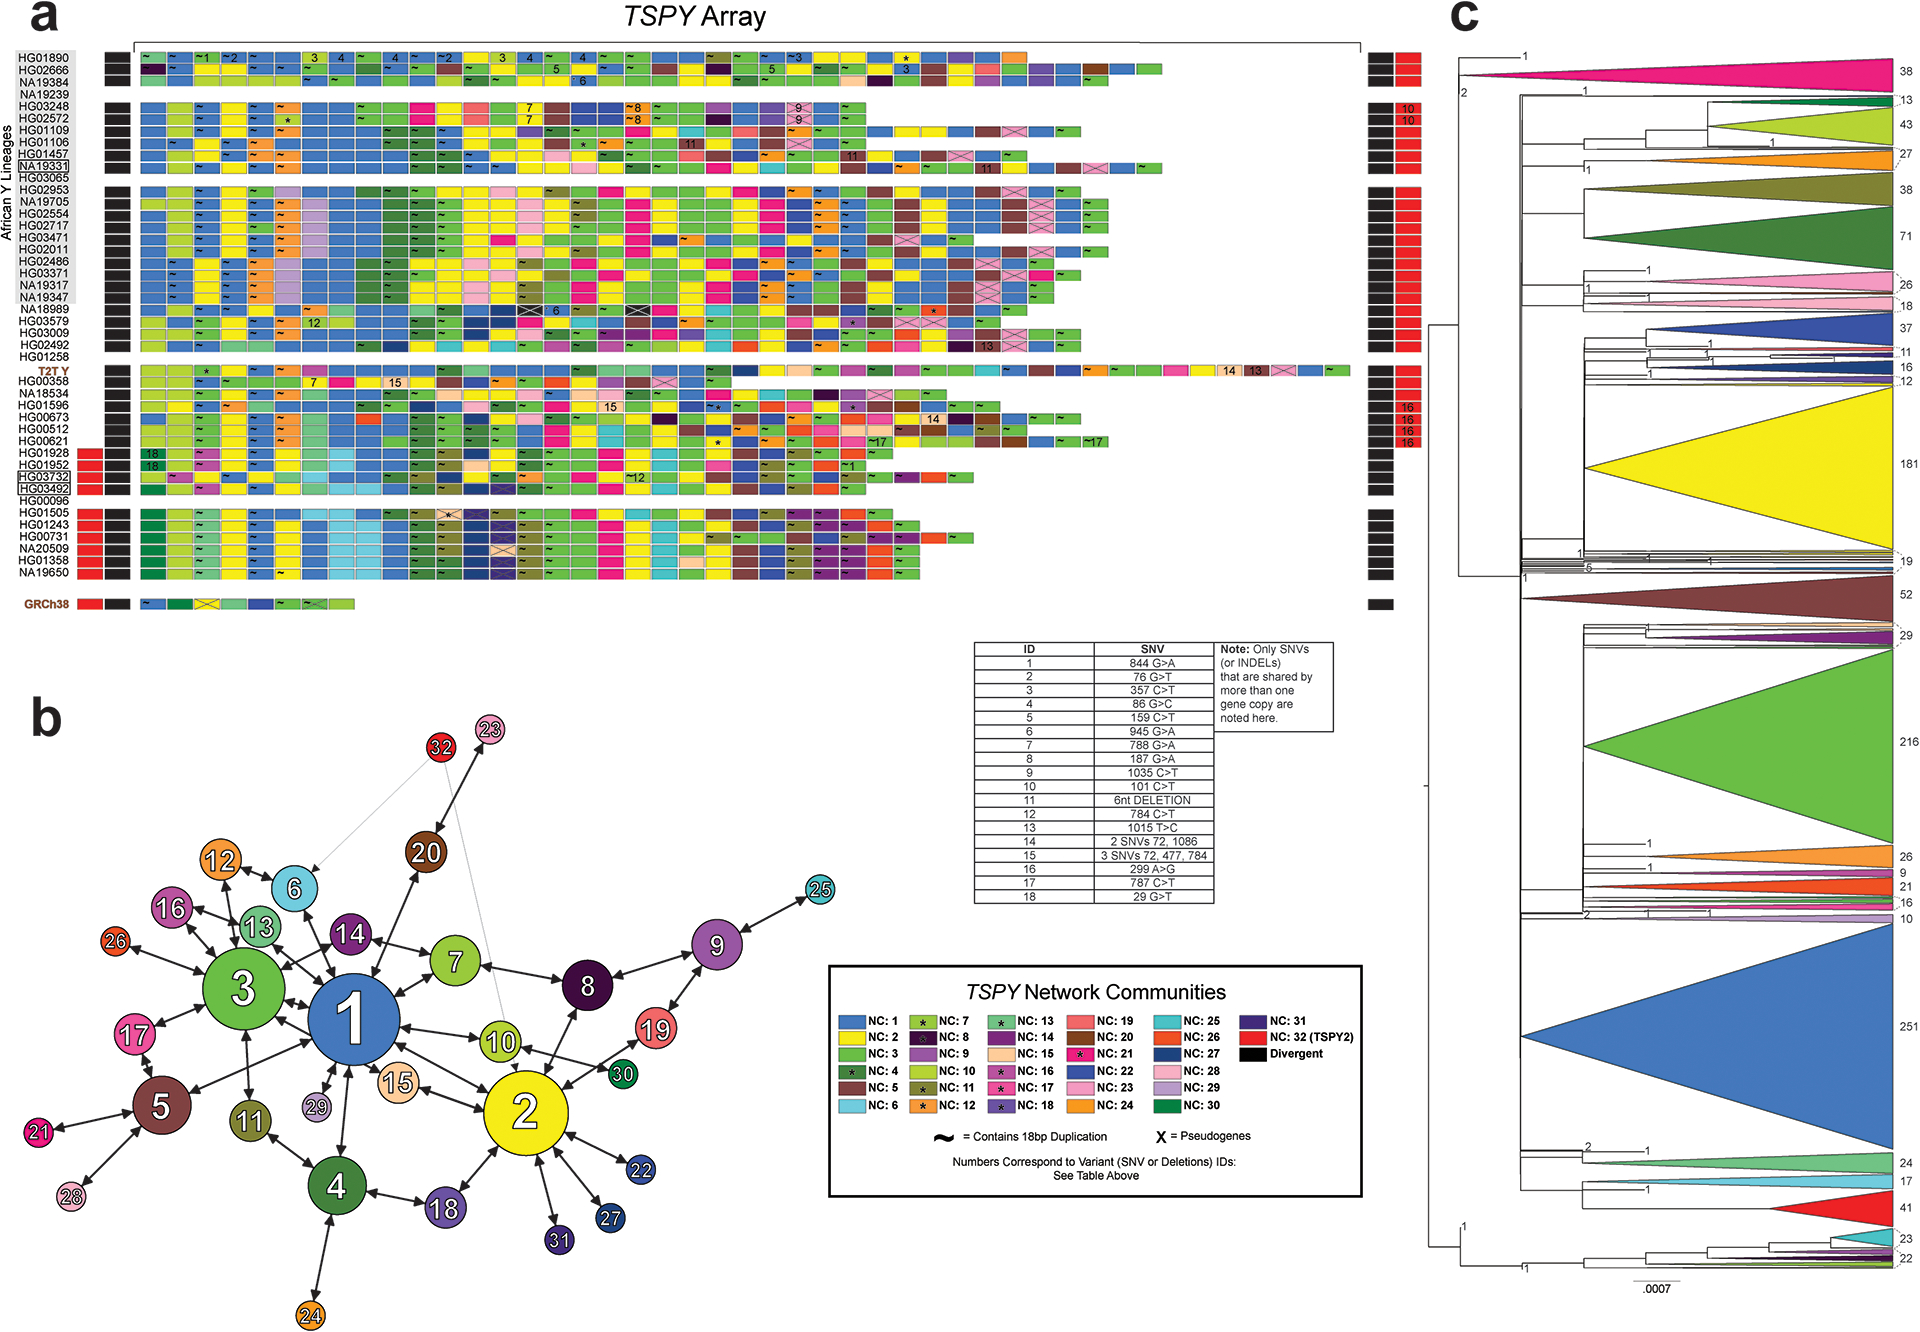
a. TSPY array visualization of each sample with contiguous assembly in this region. Individual TSPY gene copies are shown (rectangles), and their colour is based on the assigned network community (NC) (Methods). Sample names with black rectangles (NA19331, HG03732 and HG03492) carry the IR3/IR3 inversion and were re-oriented for visualisation. Asterisks within individual gene copies indicate possible gene conversion (GC) or recombination (R) events unique to that gene copy. If a GC/R event is shared by a NC an asterisk is shown in the NC legend rectangle. The TSPY2 gene copy is shown as a red rectangle.
b. A secondary directed network showing the sequence similarity between NC consensus sequences. An edge pointing from one node to a second node indicates that the second node was the first’s closest match (i.e., most similar sequence; ties are allowed and shown as multiple edges stemming from a node). The width of the edge represents the sequence similarity between two nodes (i.e., NC consensus sequence similarity; thicker means less SNVs). The node size is representative of the total edges pointing to the node.
c. TSPY phylogenetic analysis of exonic nucleotide sequences. Shown is the unrooted phylogenetic tree of TSPY genes constructed using a maximum likelihood approach (Methods). This tree is rooted at the midpoint and the total count of TSPY copies is shown on the right. The scale bar represents the average number of substitutions per site. The early split/rise of NC1 within the tree, in conjunction with the secondary directed network and manual comparison of TSPY sequences (as well as their presence across all lineages) suggests that NC1 TSPY copies represent the ancestral TSPY gene sequence.